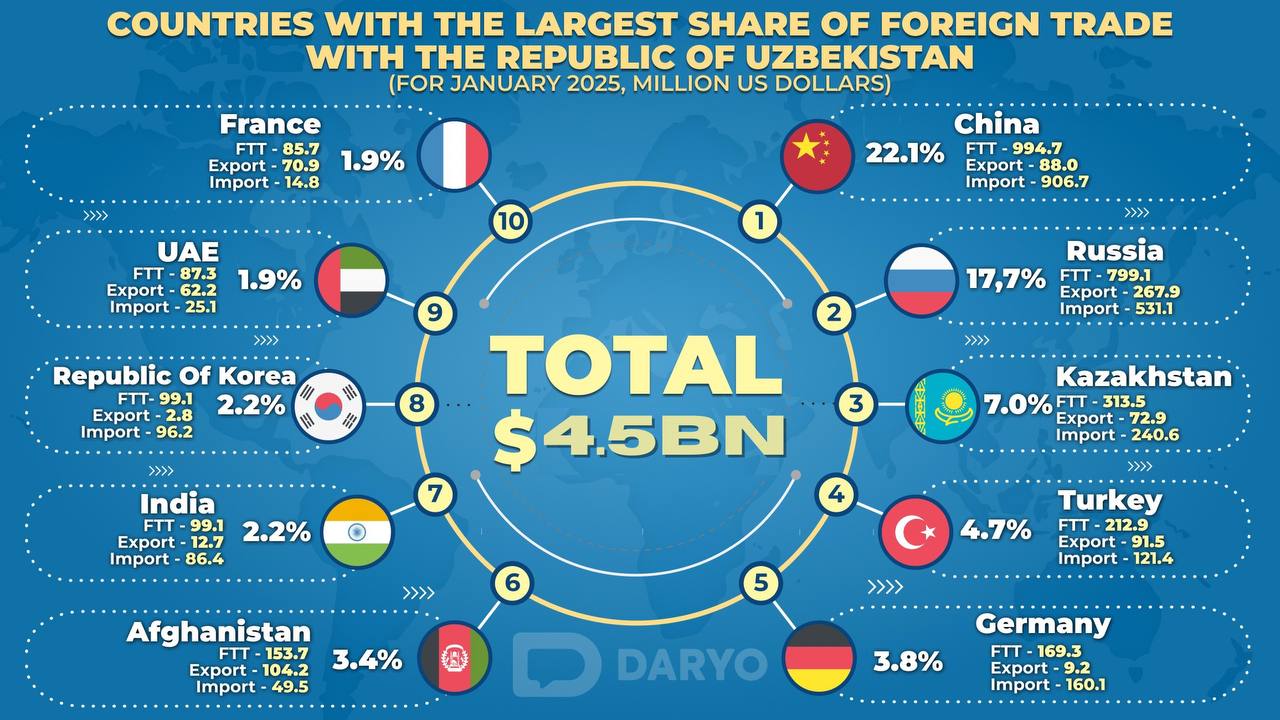
Uzbekistan’s foreign trade turnover (FTT) reached $4.5bn in January 2025, marking an increase of $297.2mn, or 7.1%, compared to the same period in 2024. This growth reflects the country’s continued efforts to expand exports and optimize imports despite challenges in key industries.
In terms of trade balance, Uzbekistan’s exports totaled $1.3bn, reflecting a 14.1% increase, while imports amounted to $3.19bn, marking a 4.4% rise. As a result, the country recorded a trade deficit of $1.89bn, highlighting a continued reliance on imports to meet domestic demand.
Key Trade Partners
Uzbekistan maintained trade relations with 154 countries in January 2025. China remained the largest trade partner, accounting for $994.7mn (22.1% of total trade) in January 2025. While this marks a decline from $1.14bn in January 2024, it remains significantly higher than the $549.3mn recorded in 2023.
Russia was the second-largest trade partner, with a trade volume of $799.1mn (17.7%) in January 2025. While this represents a slight increase from $766.2mn in January 2024, it remains higher than the $691.5mn recorded in 2023.
Kazakhstan ranked third with a trade volume of $313.5mn (7.0%) in January 2025. This marks an increase from $270.9mn in January 2024 but a decline from $336.6mn in 2023, indicating fluctuations in trade dynamics over the years.
Other significant trade partners included Türkiye ($212.9mn)and Germany ($169.3mn). Trade with CIS countries increased by 2.4% to $1.65bn, while trade with non-CIS countries declined by 2.4%, making up 63.5% of total trade.
Sectoral Insights
Uzbekistan’s exports saw notable growth in energy, food, and chemical products, while key sectors such as textiles and automobiles experienced sharp declines. Food exports increased by 23.1% to $143.2mn, driven by higher shipments of fruits, vegetables (+19.1%), and grains (+14.8%).
Chemical exports rose by 22.6% to $133.1mn, with inorganic substances up 20.5%. The energy sector also performed well, with oil product exports nearly doubling to over $30mn and gas exports increasing by 9% to $21.8mn.
However, manufactured goods exports declined by 4.6% to $265.5mn, with textile exports dropping by 22.5% to $133.9mn. The automobile sector faced a major setback, as car and component exports fell by two-thirds to $6.6mn.
On the import side, machinery, fuel, and food products remained the key drivers of growth. While machine-building products were the largest import category, they saw a 15.1% decline.
In contrast, industrial equipment imports surged 28.6% to $235.7mn, while automobile and component imports rose 10.1% to $243.8mn. Chemical imports grew 12% to $408.6mn, with medical product imports reaching $171.1mn.
Food imports saw a sharp 33% rise to $334.7mn, driven by an 86.3% increase in meat imports and a 98.7% surge in sugar imports.
The fuel sector recorded significant growth, with imports rising 50.2% to $212.9mn, including a 5.4-fold increase in gas imports from Russia and Turkmenistan.
Follow Daryo's official Instagram and Twitter pages to keep current on world news.
Comments (0)