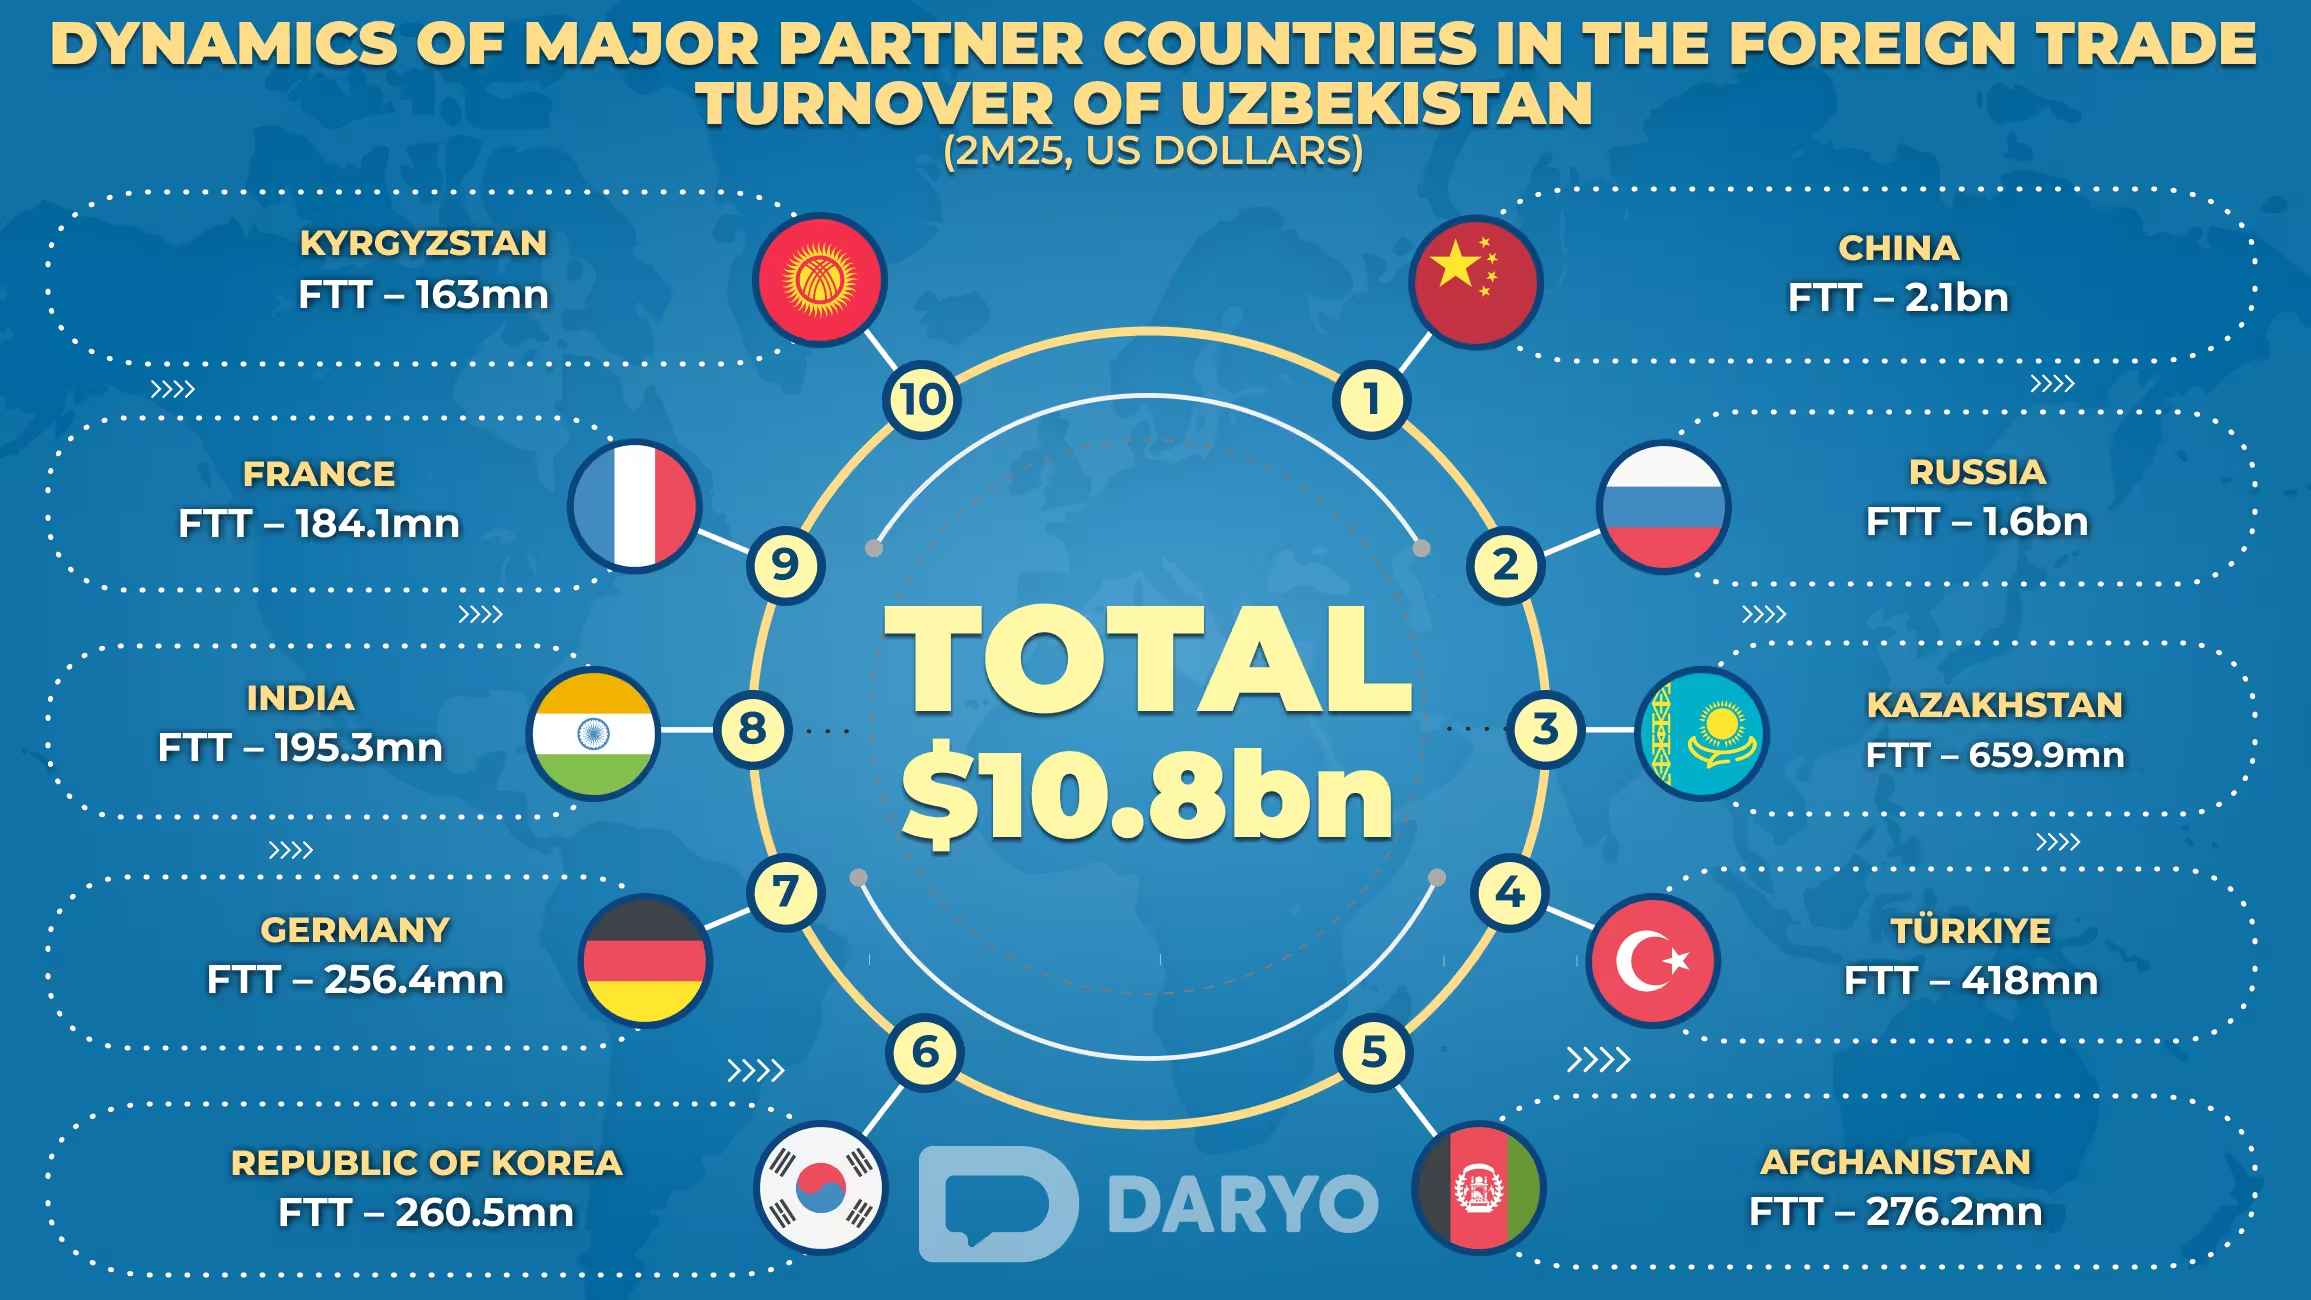
Uzbekistan’s foreign trade turnover (FTT) totaled $10.8bn in January-February 2025, marking an increase of $973.3mn (9.9%) compared to the same period in 2024. This growth was primarily driven by a rise in exports, while imports saw a slight decline.
Uzbekistan’s exports surged by 27.7% to $4.64bn, reflecting growing demand for industrial goods and services. Meanwhile, imports totaled $6.2bn, showing a 0.6% decrease from the previous year. As a result, the country recorded a trade deficit of $1.56bn, highlighting continued reliance on imports despite a positive export trend.
Key Trade Partners
Uzbekistan maintained trade relations with 162 countries in early 2025, with China, Russia, and Kazakhstan leading as the country's top trade partners.
China remained Uzbekistan's largest trade partner, with a trade volume of $2.08bn in February 2025. While this marks a slight decline from $2.12bn in 2024, it remains higher than $1.33bn in 2023. China's share in Uzbekistan’s total trade stood at 19.2%.
Russia followed as the second-largest trade partner, with a trade volume of $1.6bn in February 2025. This represents a decrease from $1.8bn in 2024, but an increase from $1.5bn in 2023. Russia accounted for 14.9% of Uzbekistan's total trade.
Kazakhstan ranked third, with trade reaching $659.9mn, up from $581mn in 2024, yet lower than $700.2mn in 2023, indicating year-on-year fluctuations. Kazakhstan's share of total trade stood at 6.1%.
Other key trade partners included Türkiye (3.9%) and Afghanistan (2.5%), further highlighting Uzbekistan's growing international trade network.
On the export side, Uzbekistan’s main trading destinations were Russia (11.8%), China (6.5%), Afghanistan (4.5%), Kazakhstan (4.0%), Türkiye (3.9%), France (3.1%), the Kyrgyzstan (2.6%), the UAE (2.1%), Tajikistan (1.5%) and Pakistan (1.3%). These countries collectively accounted for 41.3% of total exports, indicating a strong regional and international market presence.
Imports were mainly sourced from China (28.7%), Russia (17.3%), Kazakhstan (7.6%), South Korea (4.1%), Türkiye (3.8%), Germany (3.8%) and India (2.8%). More than two-thirds of Uzbekistan’s imports came from these major partners, reflecting the country’s trade diversification efforts.
Sectoral Insights
Uzbekistan’s exports saw significant growth in services and industrial goods, while the textile and agricultural sectors faced declines.
Services exports increased sharply by 61.5%, reaching $1.18bn, and accounted for 27.3% of total exports. The main contributors were transport services (40.1%), tourism (39.5%), and telecommunications & IT services (12.9%). This trend indicates a shift toward a more service-oriented economy.
In agriculture, fruit and vegetable exports saw a 23.1% decline in volume, falling to 192,900 tons. However, in value terms, exports increased 16.7% to $175.1mn, driven by rising global food prices.
The textile sector experienced a downturn, with exports dropping 22.4% to $403.7mn. Finished textile products accounted for 45.0% of total textile exports, while yarn made up 35.0%, reflecting weaker global demand in this sector.
On the import side, machinery and transport equipment remained the dominant category, comprising 36.8% of total imports. Although machinery purchases slowed, Uzbekistan continued to invest in industrial equipment and transport infrastructure.
Chemical imports made up 12.2% of total imports, reflecting stable demand for pharmaceuticals, industrial chemicals, and fertilizers. Meanwhile, service imports surged 45.4% to $660.8mn, with the sharpest increase in tourism-related services (60.3%) and transport services (19.5%).
Follow Daryo's official Instagram and Twitter pages to keep current on world news.
Comments (0)