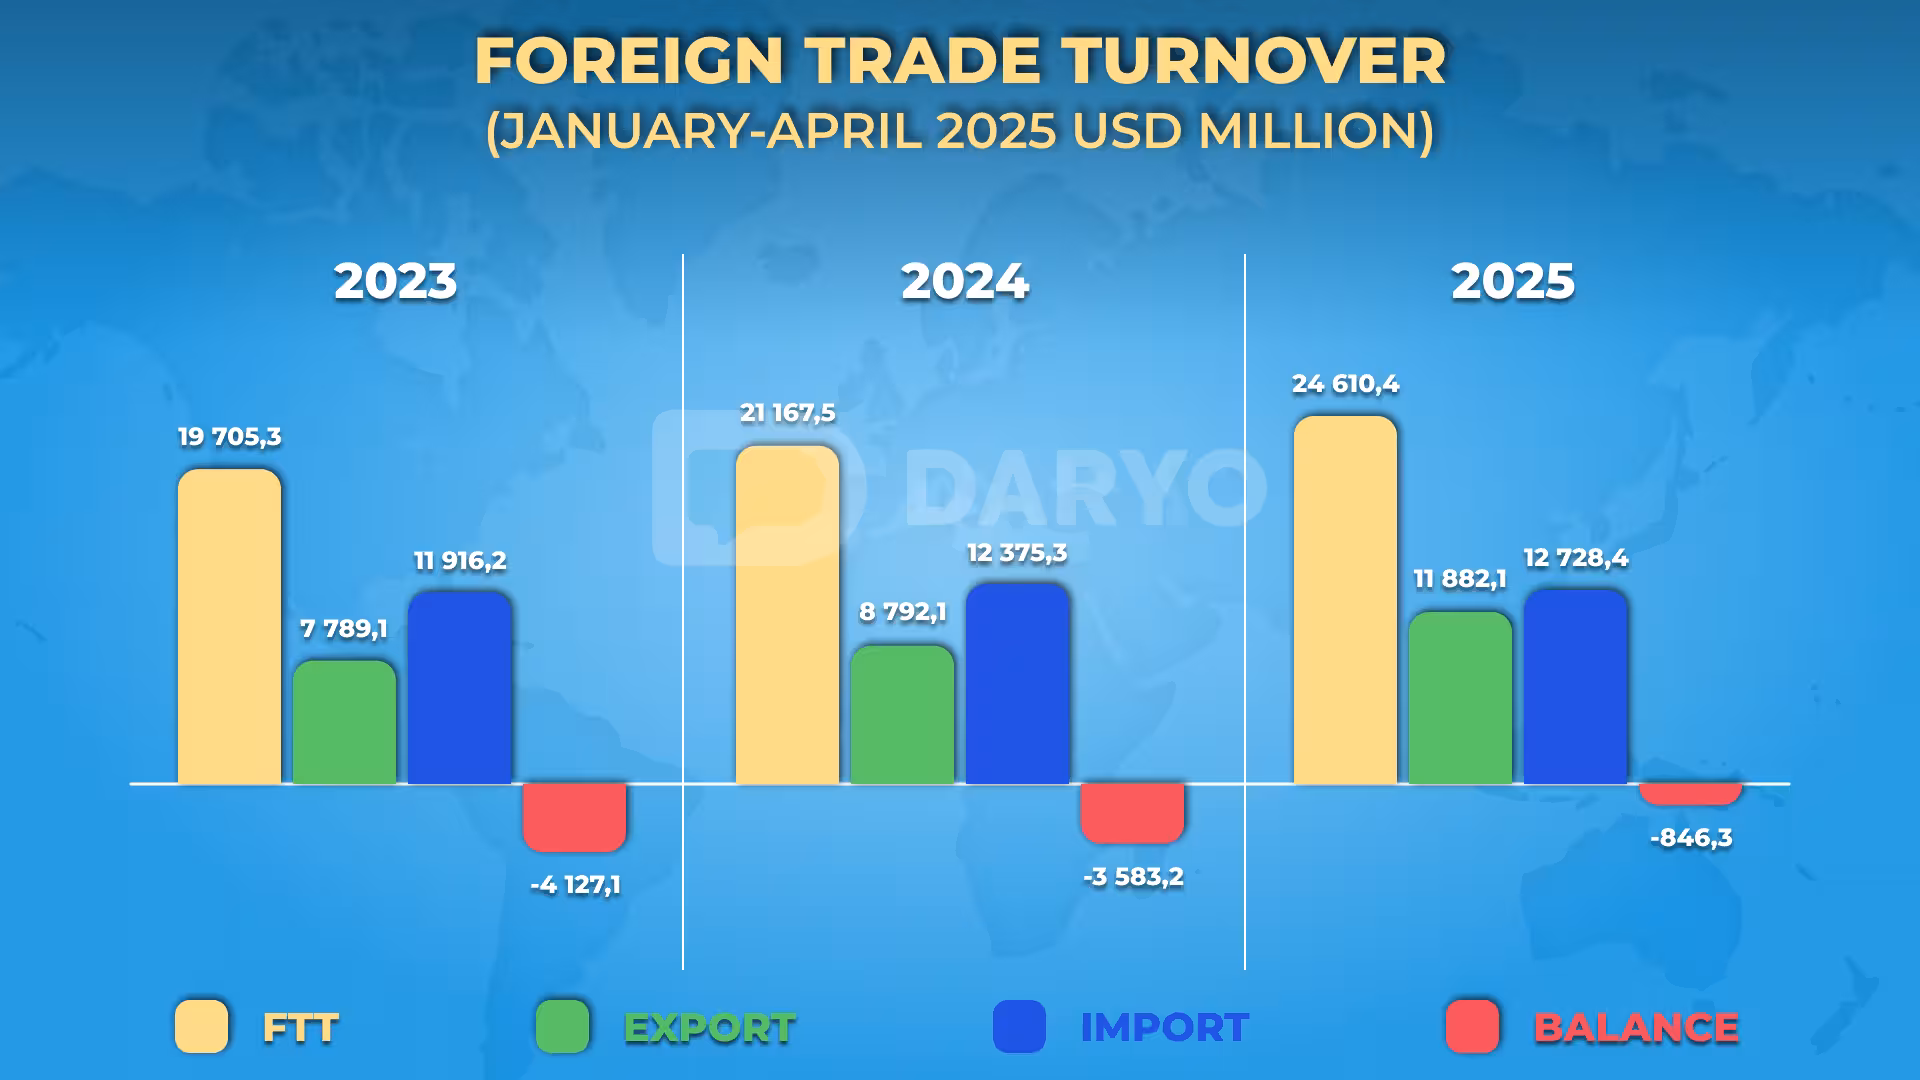
Uzbekistan’s foreign trade turnover (FTT) totaled $24.6bn in January–April 2025, marking an increase of $3.4bn (16.3%) compared to the same period in 2024. This growth was driven by increased exports, while imports showed a more modest rise.
Exports rose by 35.1% year-on-year, reaching $11.88bn, supported by higher service exports and industrial goods. Imports amounted to $12.73bn, reflecting a 2.9% increase from the previous year. As a result, the country registered a trade deficit of $846.3mn, continuing its reliance on foreign goods and services despite stronger export performance.
Key Trade Partners
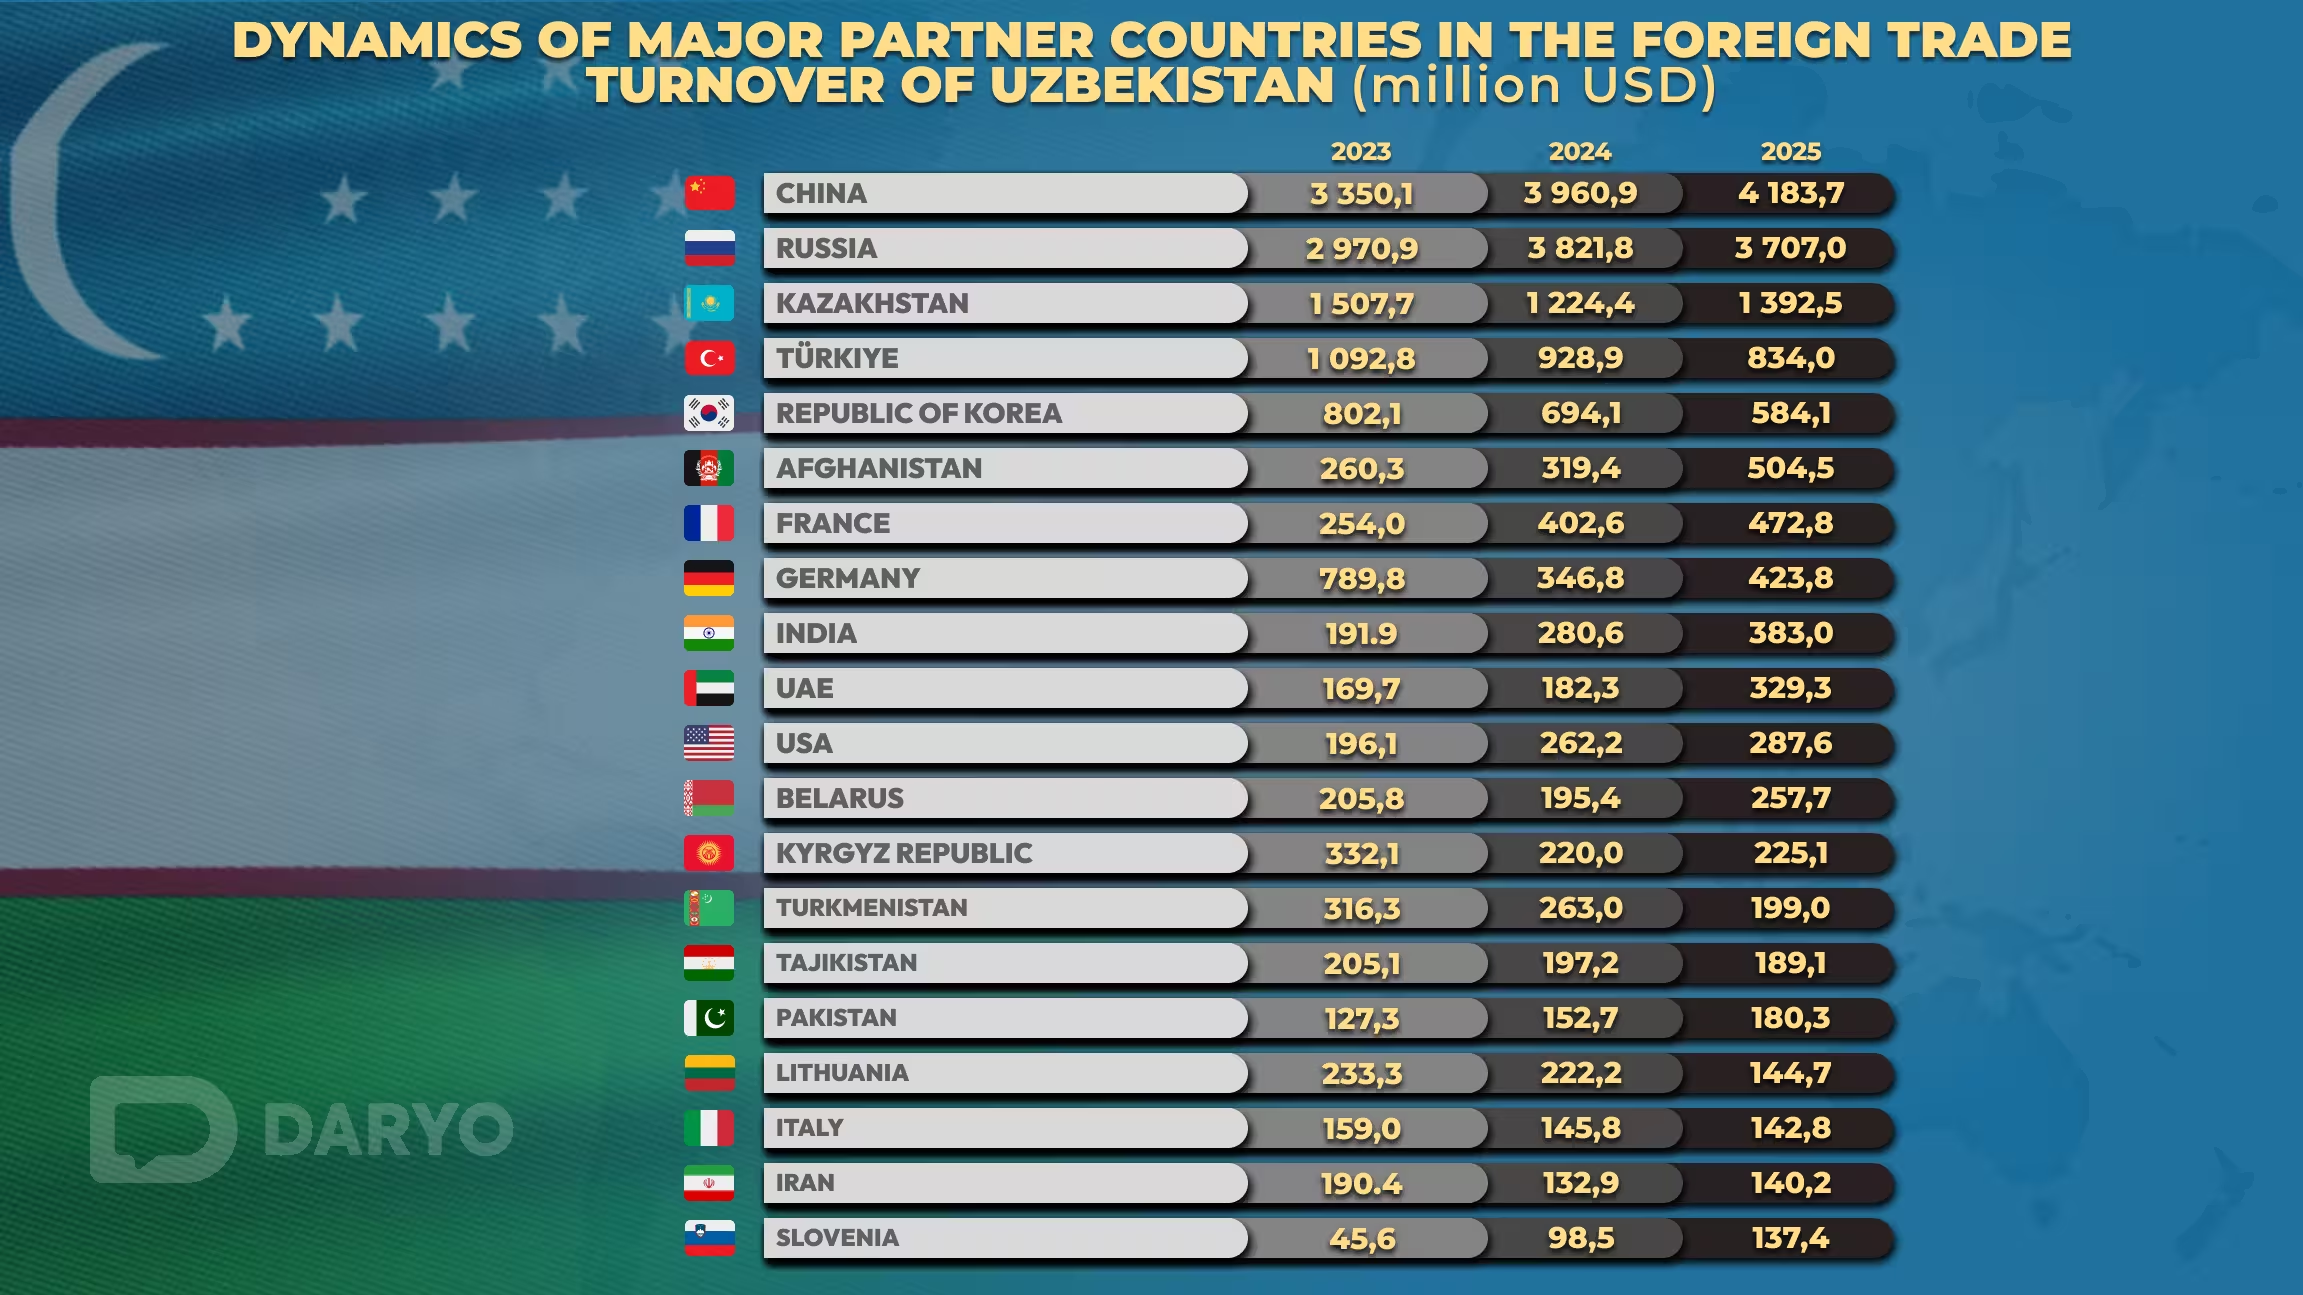
Uzbekistan maintained trade relations with 183 countries in early 2025. China, Russia, and Kazakhstan continued to dominate as Uzbekistan’s leading trade partners.
China remained the top partner, with trade turnover rising to $4.18bn in the first four months of 2025, up from $3.96bn in 2024 and $3.35bn in 2023. China accounted for the largest share of Uzbekistan’s foreign trade turnover at 17.0%. Russia followed with $3.71bn, slightly down from $3.82bn a year earlier, accounting for 15.1% of total trade. Kazakhstan ranked third with $1.39bn, up from $1.22bn in 2024 but below $1.51bn in 2023, making up 5.7% of trade.
Other key trade partners included Türkiye with 3.4% of total trade and the Republic of Korea with 2.4%. These shares highlight Uzbekistan’s growing economic ties with both neighboring and distant countries across Asia and Europe.
On the export side, Uzbekistan’s main destinations included Russia (10.2%), China (5.1%), Afghanistan (3.5%), Kazakhstan (3.4%), Türkiye (2.8%), France (2.6%), the UAE (1.5%), Tajikistan (1.3%), Kyrgyzstan (1.2%), and Pakistan (1.1%). Combined, these ten countries accounted for 32.7% of total exports, reflecting a strong presence across regional and global markets.
Imports were mainly sourced from China (28.1%), Russia (19.6%), Kazakhstan (7.8%), South Korea (4.5%), Türkiye (3.9%), Germany (3.0%), and India (2.7%). More than two-thirds of total imports came from these partners, showing Uzbekistan’s growing integration with major economies.
Sectoral Insights
Uzbekistan’s export structure showed strong growth in services and certain industrial goods, while traditional sectors like textiles and agriculture faced mixed results.
Services exports rose significantly by 36.4% year-on-year, reaching $2.5bn, and accounted for 21.1% of total exports. Tourism led with 47.2%, followed by transport services (36.9%) and telecommunications & IT services (9.4%), pointing to a rising service-based export economy.
In agriculture, Uzbekistan exported 463,200 tons of fruit and vegetables—down 9.8% in volume—but the value increased by 39.3% to $415.1mn, reflecting higher global food prices and improved pricing strategies.
Textile exports fell by 17.2% to $839.4mn, making up 7.1% of total exports. Finished textile products accounted for 46.4%, while yarn made up 33.6%, showing weakened demand in global textile markets.
On the import side, goods accounted for $11.39bn of total imports. Machinery and transport equipment continued to dominate, representing 33.9% of all imports, as the country pushed forward with industrial upgrades. Industrial goods and chemicals followed, making up 16.3% and 13.0% respectively, driven by steady demand for construction materials, fertilizers, and pharmaceuticals.
Service imports rose by 38.6% year-on-year to $1.34bn, representing 10.5% of total imports. Travel and tourism services made up 55.5% of this category, followed by transport services (20.2%) and telecommunications & IT (9.8%), indicating increasing outbound travel and business engagement abroad.
Follow Daryo's official Instagram and Twitter pages to keep current on world news.
Comments (0)