Uzbekistan’s foreign trade turnover (FTT) totaled $17.3bn in the first quarter of 2025, marking an increase of $1.37bn (8.6%) compared to the same period in 2024.
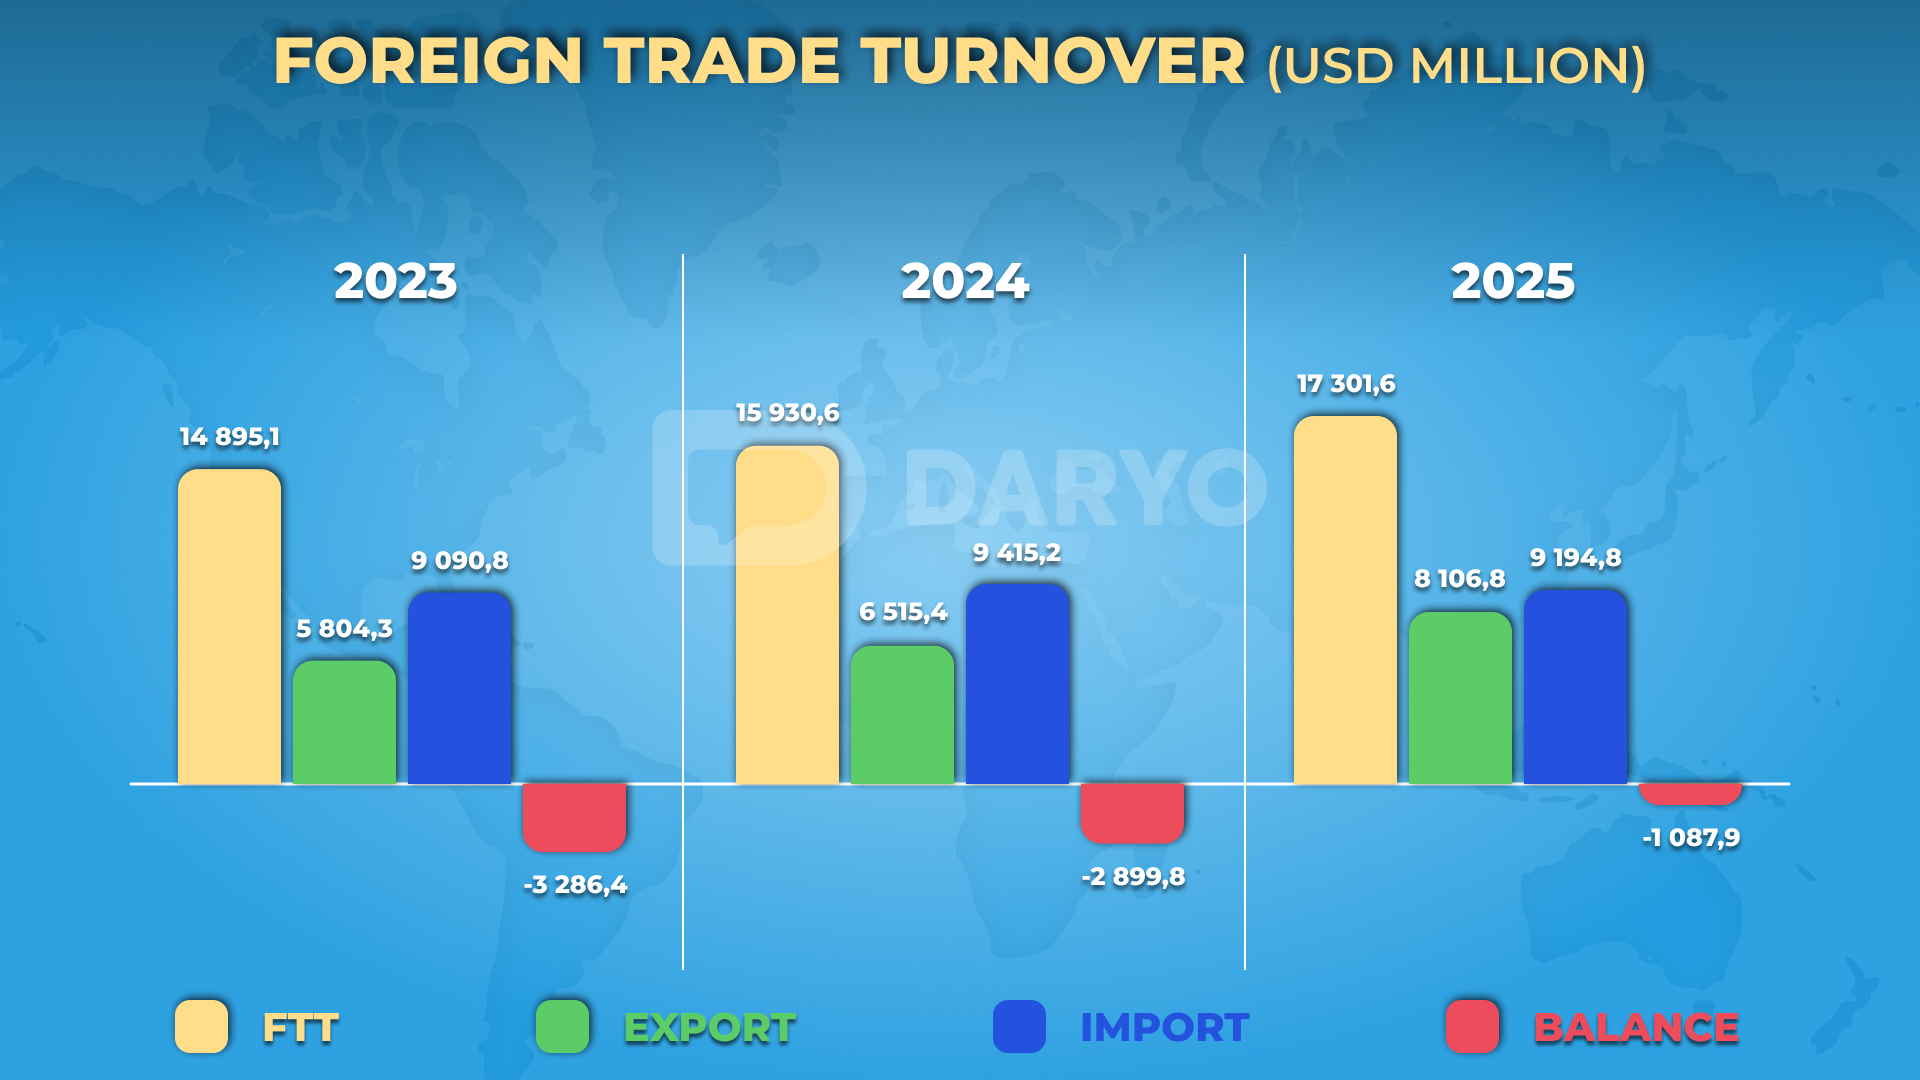
This growth was primarily driven by a surge in exports, while imports experienced a slight decline. The country’s exports reached $8.11bn, reflecting a robust 24.4% y/y increase, with strong demand for industrial goods and services.
On the other hand, imports amounted to $9.19bn, showing a decrease of 2.3% from the previous year. As a result, Uzbekistan recorded a trade deficit of $1.09bn, highlighting its reliance on imports despite the positive export growth.
Key Trade Partners
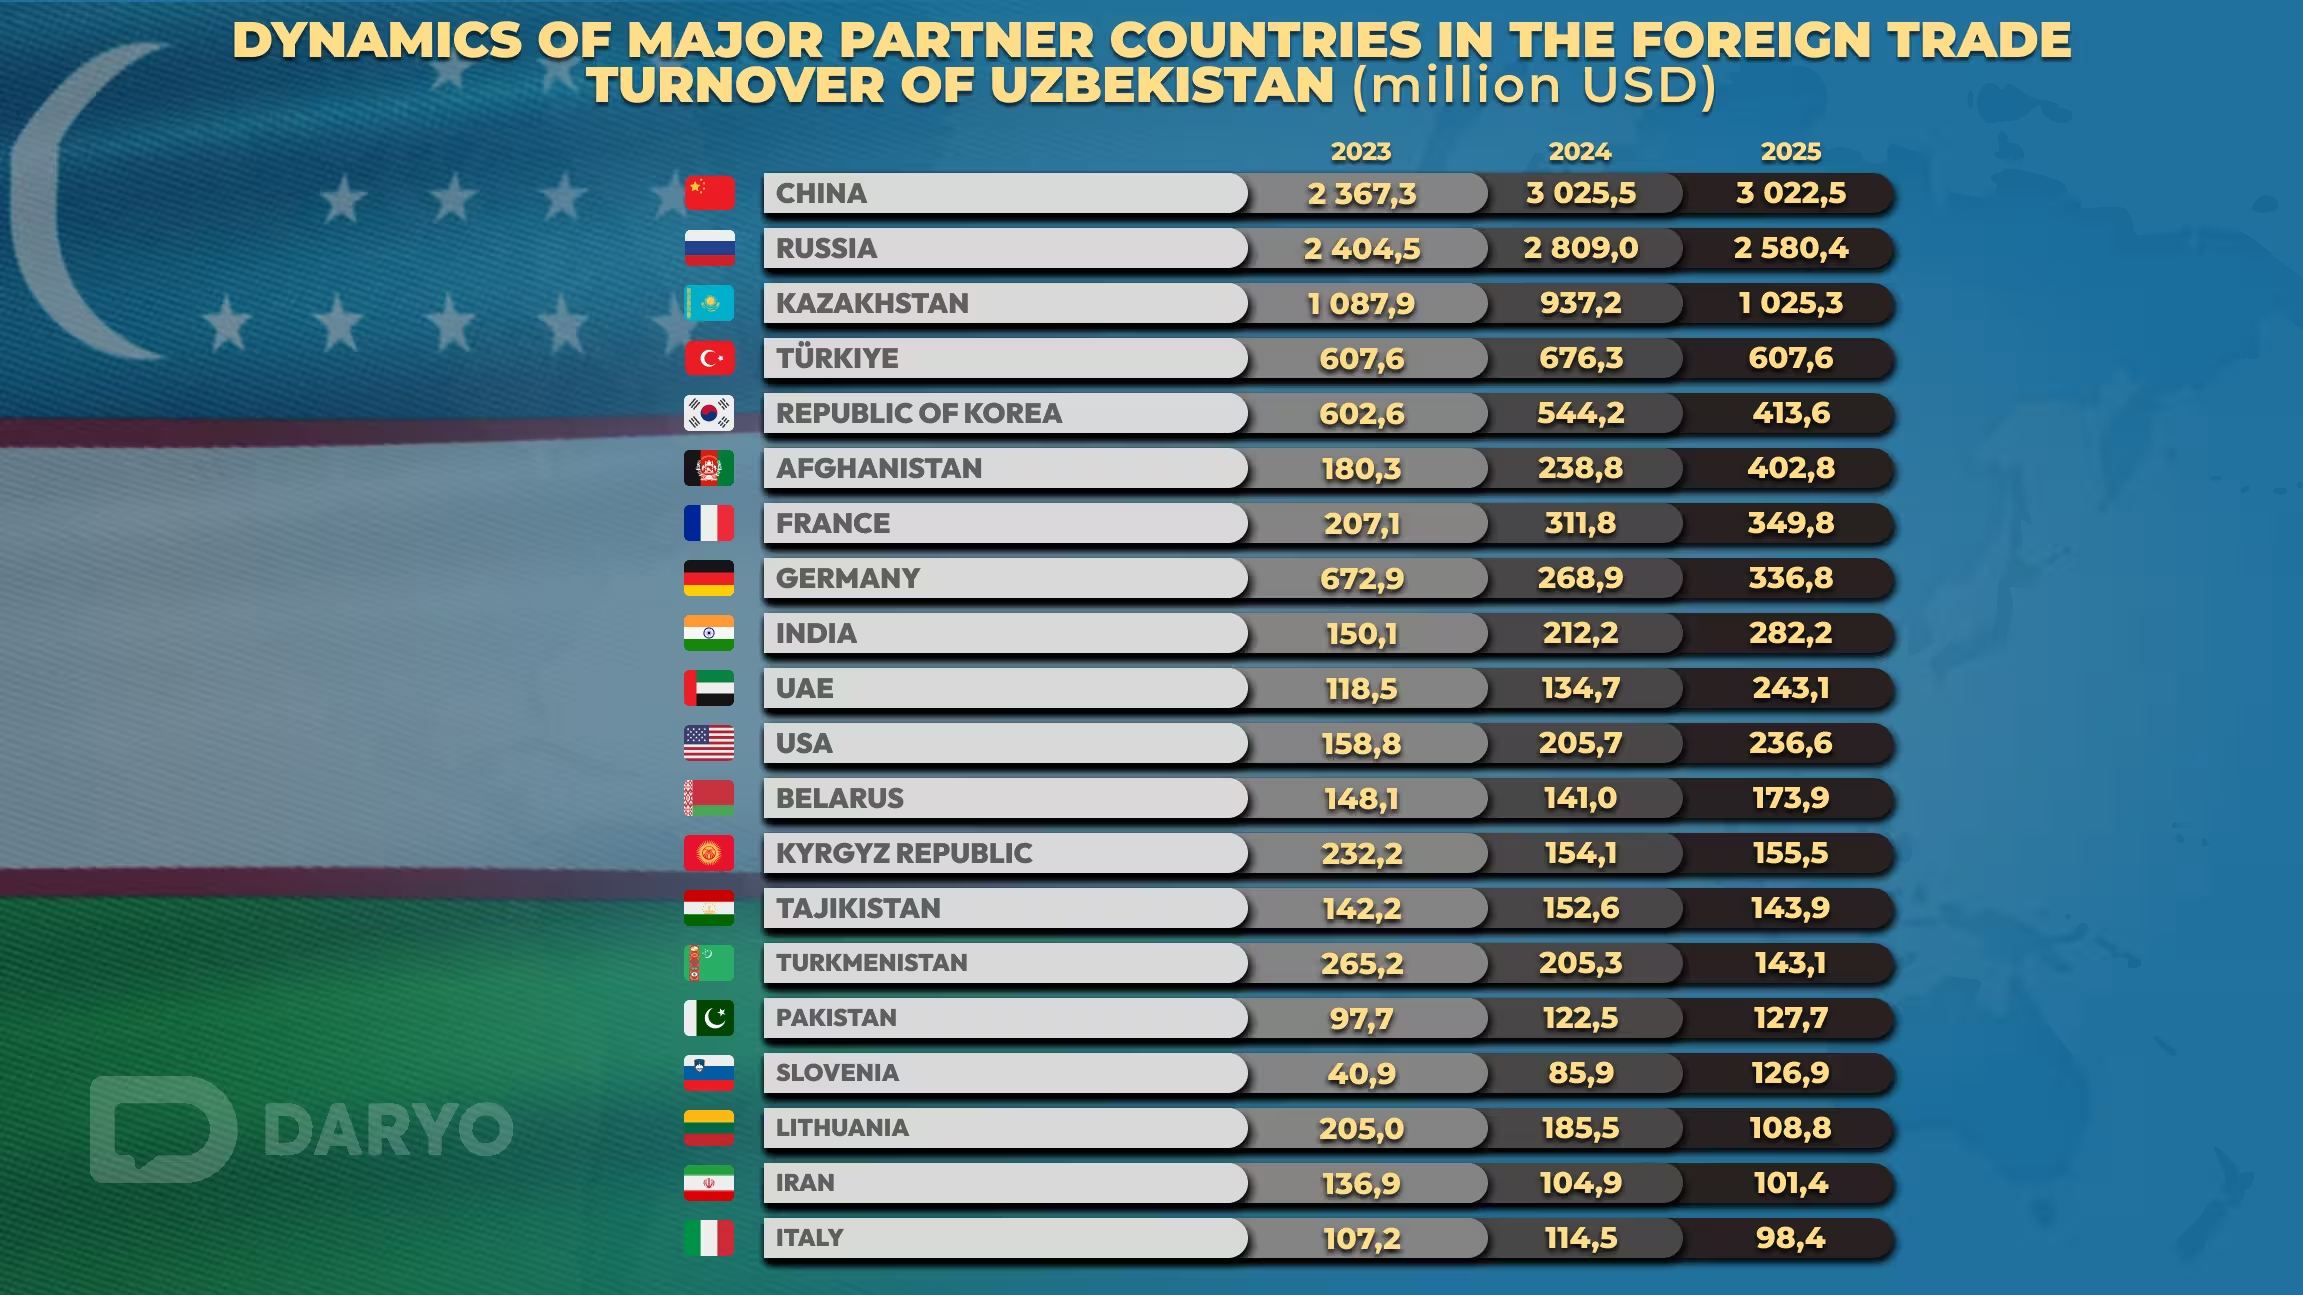
Uzbekistan maintained trade relations with 173 countries in early 2025, with China, Russia, and Kazakhstan as its top trade partners.
China remained Uzbekistan's largest trade partner, with a trade volume of $3.02bn in 1Q25, nearly unchanged from $3.03bn in 2024. China's share in Uzbekistan’s total trade stood at 17.5%.
Russia followed as the second-largest trade partner, with a trade volume of $2.58bn in 1Q25, down from $2.81bn in 2024 but still higher than $2.4bn in 2023. Russia accounted for 14.9% of Uzbekistan's total trade.
Kazakhstan ranked third, with trade reaching $1.03bn, up from $937.2mn in 2024, marking a positive trend despite fluctuations in prior years. Kazakhstan's share of total trade stood at 5.9%.
Other key trade partners included Türkiye (3.5%) and South Korea (2.4%), further indicating Uzbekistan's expanding international trade network.
Export and Import Breakdown
On the export side, Uzbekistan’s main trading destinations were Russia (10.9%), China (5.6%), Afghanistan (3.9%), Kazakhstan (3.8%), and Türkiye (3.1%), collectively accounting for 35.4% of total exports.
Imports were mainly sourced from China (27.9%), Russia (18.4%), Kazakhstan (7.8%), South Korea (4.4%), and Türkiye (3.9%). These countries accounted for over two-thirds of Uzbekistan’s imports, reflecting the country’s ongoing trade diversification efforts.
Sectoral Insights
Uzbekistan’s exports saw significant growth in services and industrial goods, while the textile and agricultural sectors faced challenges. Services exports grew sharply by 37.9%, reaching $1.73bn, and accounted for 21.4% of total exports. The main contributors were transport services (40.5%), tourism (43.7%), and telecommunications & IT services (8.4%).
This indicates Uzbekistan’s transition towards a more service-oriented economy. Fruit and vegetable exports saw a notable decline, down by 27.6% in volume to 282,500 tons. However, in value terms, fruit and vegetable exports increased by 28.8% to $282.6mn, driven by higher global food prices.
These products accounted for 3.5% of total exports. Textile exports amounted to $629.3mn, a decrease of 19.1% compared to 1Q24. Finished textile products made up 45.0% of textile exports, while yarn accounted for 35.0%, reflecting a slowdown in global demand for these goods.
On the import side, machinery and transport equipment remained the dominant category, comprising 35.1% of total imports. Despite a slight decrease in machinery imports, Uzbekistan continued to invest in infrastructure and industrial growth.
Chemical imports made up 13.1% of total imports, with stable demand for pharmaceuticals, industrial chemicals, and fertilizers. Service imports surged by 32.9% to $967.3mn, with the highest growth in tourism-related services (58.3%) and transport services (19.1%).
Follow Daryo's official Instagram and Twitter pages to keep current on world news.
Comments (0)