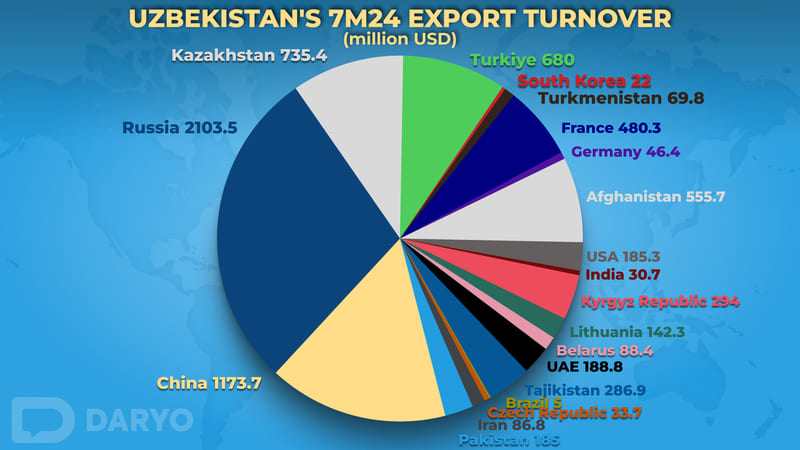
In the first seven months of 2024, Uzbekistan’s exports reached $14.7bn down 1.1% y/y. From January-July 2024, the country’s foreign trade turnover amounted to $36.8bn and increased compared to the same period in 2023 by $1.9bn, or 5.3%.
Export destinations and performance
Russia maintaining its position as Uzbekistan's top export destination, saw a substantial increase in export volumes rising by 28.36% from $16bn in 2023 to $2.1bn in 2024. In contrast, China experienced a sharp decline in export volume dropping by 23.35% to $1.1bn from $1.5bn in 2023. Kazakhstan, ranked third also saw a decline with exports decreasing by 8.94% to $735.4mn in 2024 from $807.7mn the previous year.

Türkiye, recorded a significant decline in export volume by 19.2% falling from $841.5mn in 2023 to $680mn in 2024, placing it as the fourth-largest export partner. Afghanistan however, showed positive growth with a 19.1% increase in exports, rising from $466.7mn in 2023 to $555.7mn in 2024. France experienced an increase in export volume by 100.5% jumping from $239.5mn to $480.3mn. Conversely, Kyrgyz Republic saw a sharp decline in exports decreasing by 36.55% from $463.7mn to $294.0mn. Tajikistan and the UAE saw mixed results, with Tajikistan experiencing a decline of 14.9% from $337.2mn in 2023 to $286.9mn in 2024, while the UAE saw a strong increase of 41.5% in export volume from $133.4mn in 2023 to $188.8mn in 2024.
The United States also demonstrated significant growth, with export volumes more than doubling, increasing by 121.2% from $83.9mn in 2023 to $185.3mn in 2024. Pakistan saw a significant increase in exports, rising by 51.6% from $122.0mn to $185.0mn and Great Britain experienced a 54.3% increase, with exports growing from $66.5mn to $102.8mn. Azerbaijan also recorded growth, with exports increasing by 33.7%, from $72.9mn to $97.4mn. However, Iran saw a decline of 21.5%, with exports falling from $110.8mn to $86.8mn.
Turkmenistan experienced a significant decrease of 35.9%, dropping from $109.1mn to $69.8mn. Poland's exports slightly decreased by 3.8%, from $61.0mn to $58.8mn while Latvia saw a decrease of 9.3%, from $61.5mn to $55.6mn. Germany, despite being a smaller trading partner, also saw a slight decline of 2.3%, with exports dropping from $47.9mn to $46.4mn.
Export categories
In 7M24, 1,214.9 thousand tons of fruit and vegetable products were exported marking increase of 8.1% or 91.3 thousand tons, compared to y/y 2023. The primary export destinations for these products were Russia (43.4%), Pakistan (15.3%), Kazakhstan (15.3%) and Afghanistan (5.9%). The export value of fruit and vegetable products reached $792.3mn representing a growth rate of 17.7% compared to y/y. Overall, these exports accounted for 5.4% of the total export volume.
Textile products were exported totaling $1.7bn making up 12.0% of the total export volume. This represents a decline of 4.4% compared to the same period in 2023. Yarn and finished textile goods were the largest contributors within this category, accounting for 45.8% and 38.5% of textile exports respectively. During this period, textile products were exported to 55 countries.
Food and live animal exports increased by 5.5% from $1,028.9mn to $1,085.4mn representing 7.3% of total exports. Meanwhile, drinks and tobacco exports saw a slight decline of 3.3%, dropping from $72.4mn to $70mn. Non-food raw materials, excluding fuel grew by 7.7%, increasing from $170.2mn to $183.3mn. Exports of mineral fuels, lubricating oils and similar materials experienced substantial growth rising by 49.1% from $532mn to $793mn now making up 5.4% of total exports. Animal and vegetable oils, fats and waxes exports surged by 252.4% from $6.6mn to $23.2mn. Chemicals and similar products also saw a significant increase of 35.3%, with exports rising from $692mn to $936mn contributing 6.3% to the total export volume.
However, industrial goods exports showed a marginal growth of 1.5%, from $2.44bn to $2.47bn while machinery and transport equipment exports declined by 4.8% dropping from $682.8mn to $650.1mn. Various finished products fell by 13.6%, from $733mn to $633.8mn. Other products including non-monetary gold experienced a sharp decline of 25.3%, from $5.6bn to $4.2bn. Lastly, services exports grew by 26.3% increasing from $2.9bn to $3.7bn which now accounts for 25.1% of the total exports. Overall, goods accounted for 74.9% of Uzbekistan's exports with significant contributions from other goods (28.6%), industrial goods (16.8%) and food products and live animals (7.3%).
Follow Daryo's official Instagram and Twitter pages to keep current on world news.
Comments (0)