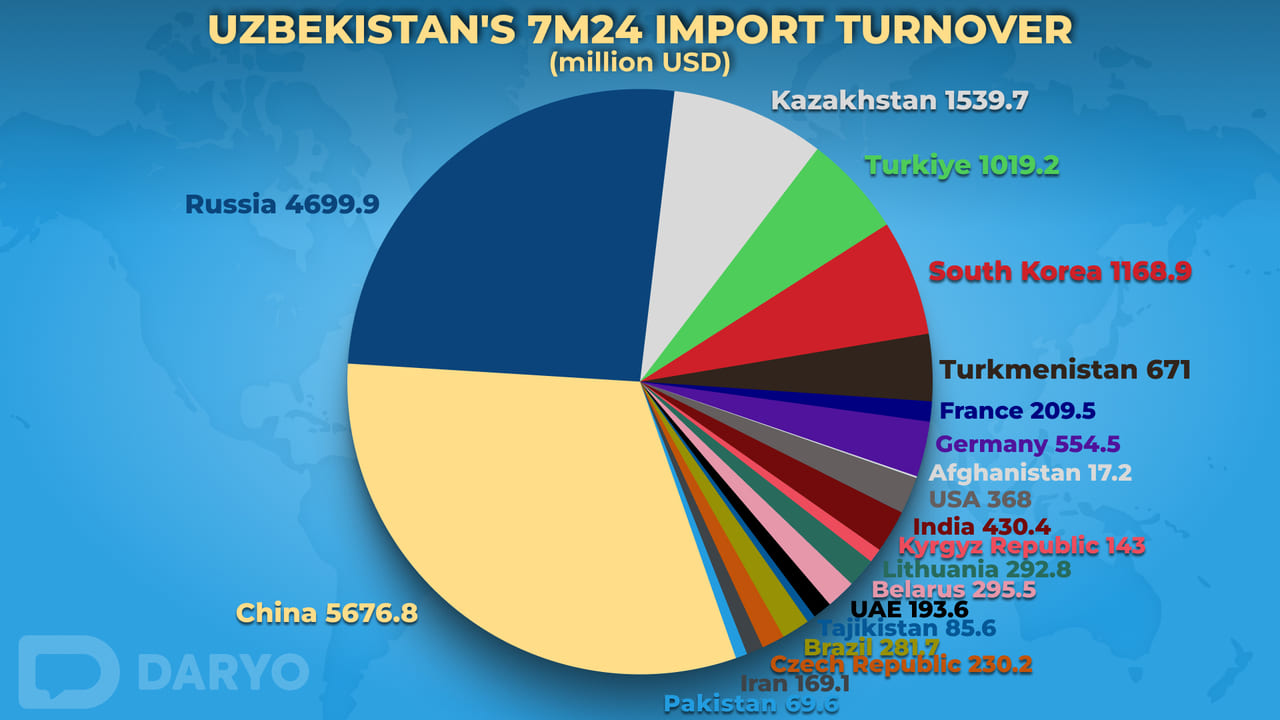
Imports to Uzbekistan totaled $22bn in the first seven months of 2024 reflecting a growth rate of 10.1% y/y. This import volume surpassed the country's exports resulting in a trade deficit. The majority of imports were concentrated in machinery and transport equipment (35.4%), industrial goods (15.1%) and chemicals and related products (12.4%). Between January and July 2024 the volume of imported goods rose by $1.38bn while imports of services reached $1.9bn. Overall, Uzbekistan imported goods and services from 164 countries during this period with more than two-thirds of imports coming from major partners such as China, Russia, Kazakhstan, South Korea, Türkiye, Turkmenistan and Germany.
Import destinations and performance
China maintained its position as Uzbekistan's top import partner, with imports increasing from $5.37bn in 2023 to $5.68bn, reflecting a modest growth rate of 5.7%. Russia also remained the second-largest import partner, experiencing a significant increase of 29.4%, with imports rising from $3.63bn to $4.70bn. Kazakhstan saw a decline of 8.5%, with imports decreasing from $1.68bn to $1.54bn, though it retained its third-place position. The Republic of Korea continued as the fourth-largest import partner, although imports slightly decreased by 6.2% from $1.25bn to $1.17bn. Türkiye held the fifth position, with a minor decline in imports by 0.5%, falling from $1.02bn to $1.02bn. Turkmenistan recorded the most notable growth among the top six, with imports surging by 75.0% from $383.3mn to $671.0mn, moving up two positions to sixth place. Germany experienced a slight decrease of 1.2%, with imports falling from $560.9mn to $554.5mn, causing it to drop to seventh place.

India showed a significant increase of 36.7%, with imports rising from $314.9mn to $430.4mn, improving its position to eighth place. The United States saw a substantial growth of 54.9%, with imports rising from $237.6mn to $368.0mn, moving up six positions to ninth. Belarus experienced a moderate growth of 10.8%, with imports increasing from $266.7mn to $295.5mn, while Lithuania saw a slight decline of 9.4%, with imports falling from $323mn to $292.8mn. Brazil witnessed a sharp decline of 32.1%, with imports dropping from $415mn to $281.7mn, pushing it down to twelfth place. The Czech Republic recorded significant growth of 30%, with imports increasing from $177.1mn to $230.2mn, moving up nine positions to thirteenth place. Italy experienced a minor decline of 4.4%, with imports falling from $233.1mn to $222.9mn.
Japan showed substantial growth of 131.2%, with imports increasing from $95.3mn to $219.6mn, moving up thirteen positions to fifteenth place. France saw a sharp decline of 24.7%, with imports dropping from $278.1mn to $209.5mn, falling four positions to sixteenth place. The UAE experienced a slight decline of 15.4%, with imports falling from $228.7mn to $193.6mn, holding its seventeenth place position. Iran recorded a decline of 10.9%, with imports decreasing from $189.1mn to $169.1mn. Switzerland saw a significant decline of 22.8%, with imports falling from $207.1mn to $159.8mn, while Poland experienced a minor decline of 11.6%, with imports decreasing from $180.8mn to $159.3mn, holding its twentieth position.
Import categories
Non-food raw materials, excluding fuel, experienced a decline of 10.4%, with imports decreasing from $657.8mn to $591mn reducing their contribution to the total imports from 3.3% to 2.7%. On the other hand, mineral fuels, lubricating oils and similar materials saw a substantial increase of 78.1%, rising from $1.38bn to $2.47bn. This category's share of total imports surged from 6.9% to 11.2%, reflecting the most significant growth among all categories. Animal and vegetable oils, fats, and waxes imports declined by 19.4%, from $238.4mn to $192mn, reducing their share in the total imports from 1.2% to 0.9%. Chemicals and similar products experienced a slight growth of 1.1%, with imports increasing from $2.71bn to $2.74bn, though their contribution to the total imports decreased slightly from 13.5% to 12.4%.
Industrial goods imports saw a modest decline of 1.7%, dropping from $3.39bn to $3.33bn, with their share of total imports decreasing from 16.9% to 15.1%. Machinery and transport equipment, the largest category, experienced a small increase of 3.8%, with imports rising from $7.52bn to $7.81bn although its share of total imports decreased slightly from 37.6% to 35.4%. Various finished products saw an increase of 5.7%, with imports rising from $755.1mn to $798.4mn, though its share of the total imports remained relatively stable at 3.6%. Other products experienced a significant decline of 2.2%, with imports decreasing from $46.8mn to $45.5mn, maintaining a minimal contribution of 0.2% to total imports.
Lastly, services imports grew substantially by 51.6% rising from $1.26bn to $1.9bn increasing their share of total imports from 6.3% to 8.6%, marking a significant shift in the import structure.
Follow Daryo's official Instagram and Twitter pages to keep current on world news.
Comments (0)