Uzbekistan’s foreign trade turnover (FTT) totaled $44.4bn in January–July 2025, marking a year-on-year increase of $7.38bn, or 19.9%, compared to the same period in 2024. The growth was driven by strong export performance, while imports posted more moderate gains.
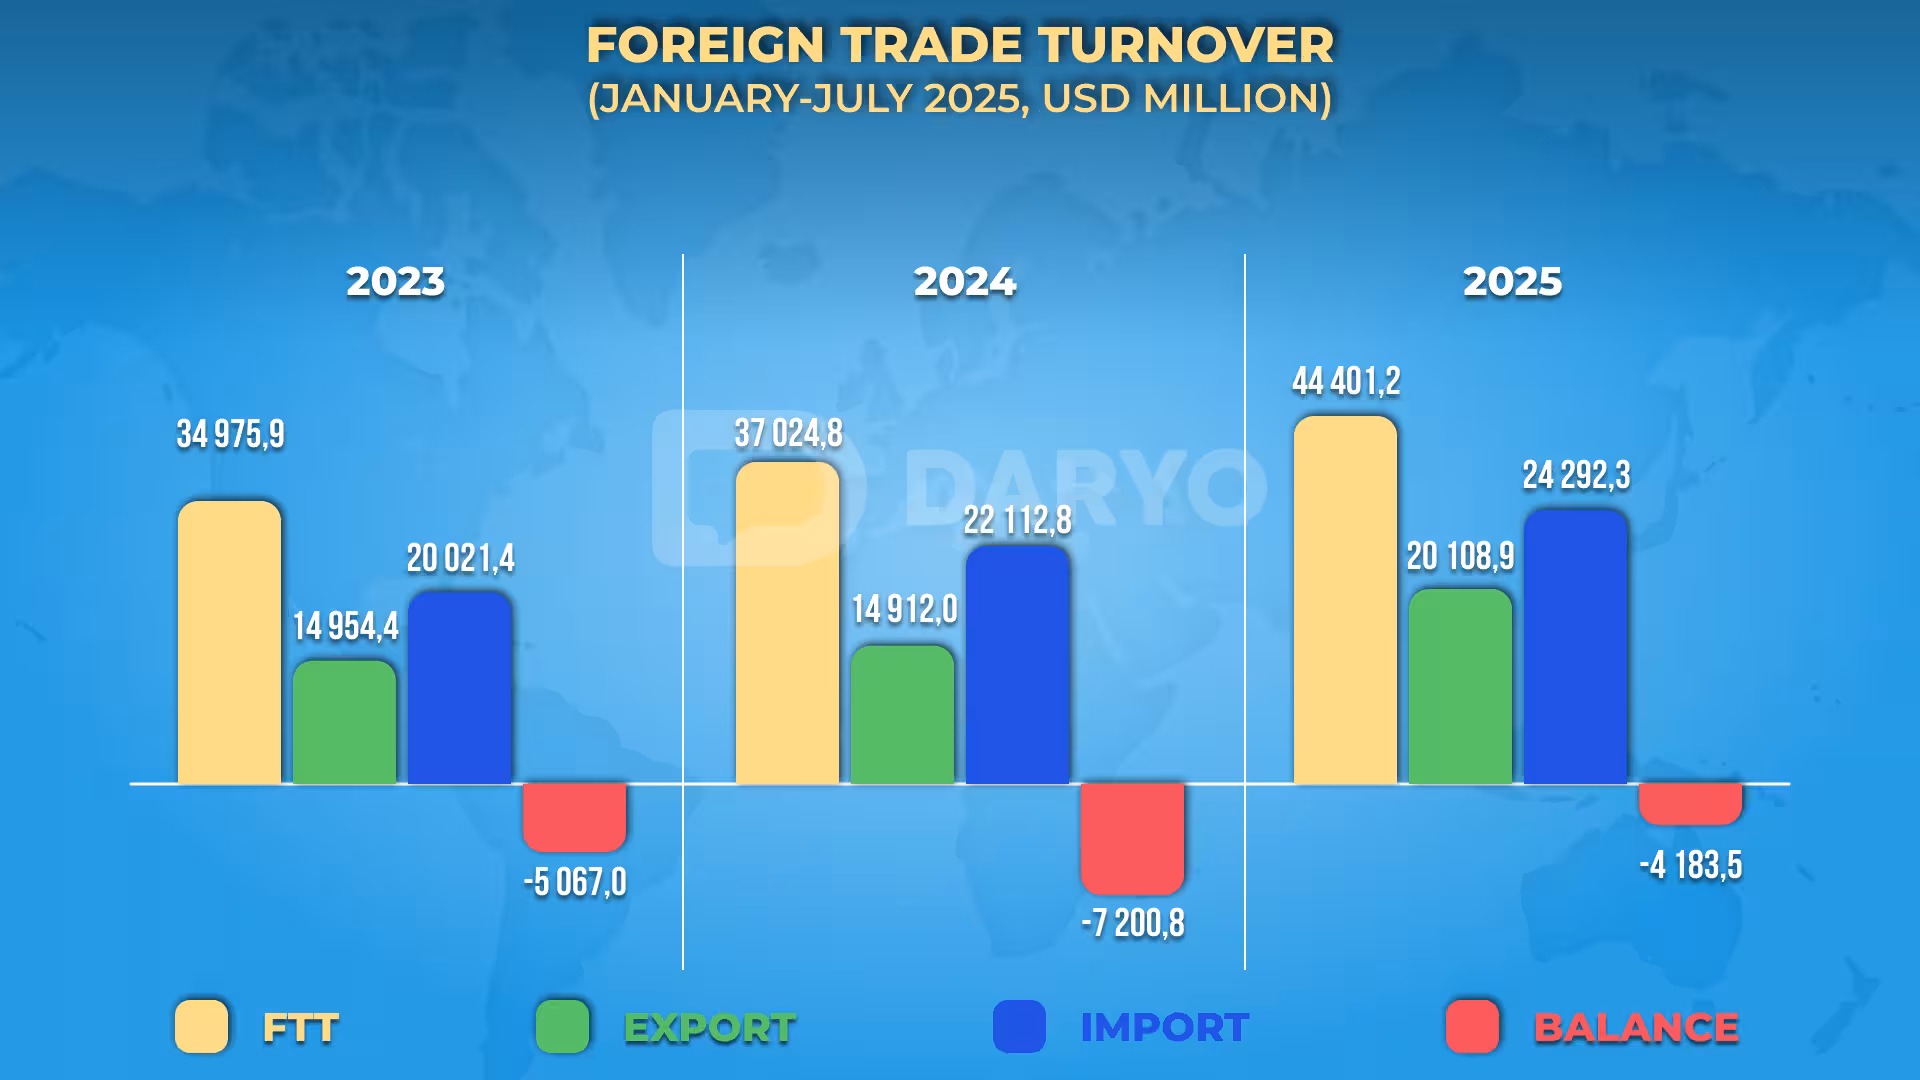
Exports reached $20.11bn, supported by higher agricultural shipments, robust service exports, and industrial goods. This represented a 34.9% increase compared to January–July 2024. Imports amounted to $24.29bn, up 9.9% y/y. As a result, the trade balance remained in deficit at –$4.18bn, underscoring the country’s continued dependence on imports of machinery, raw materials, and consumer goods.
Key Trade Partners
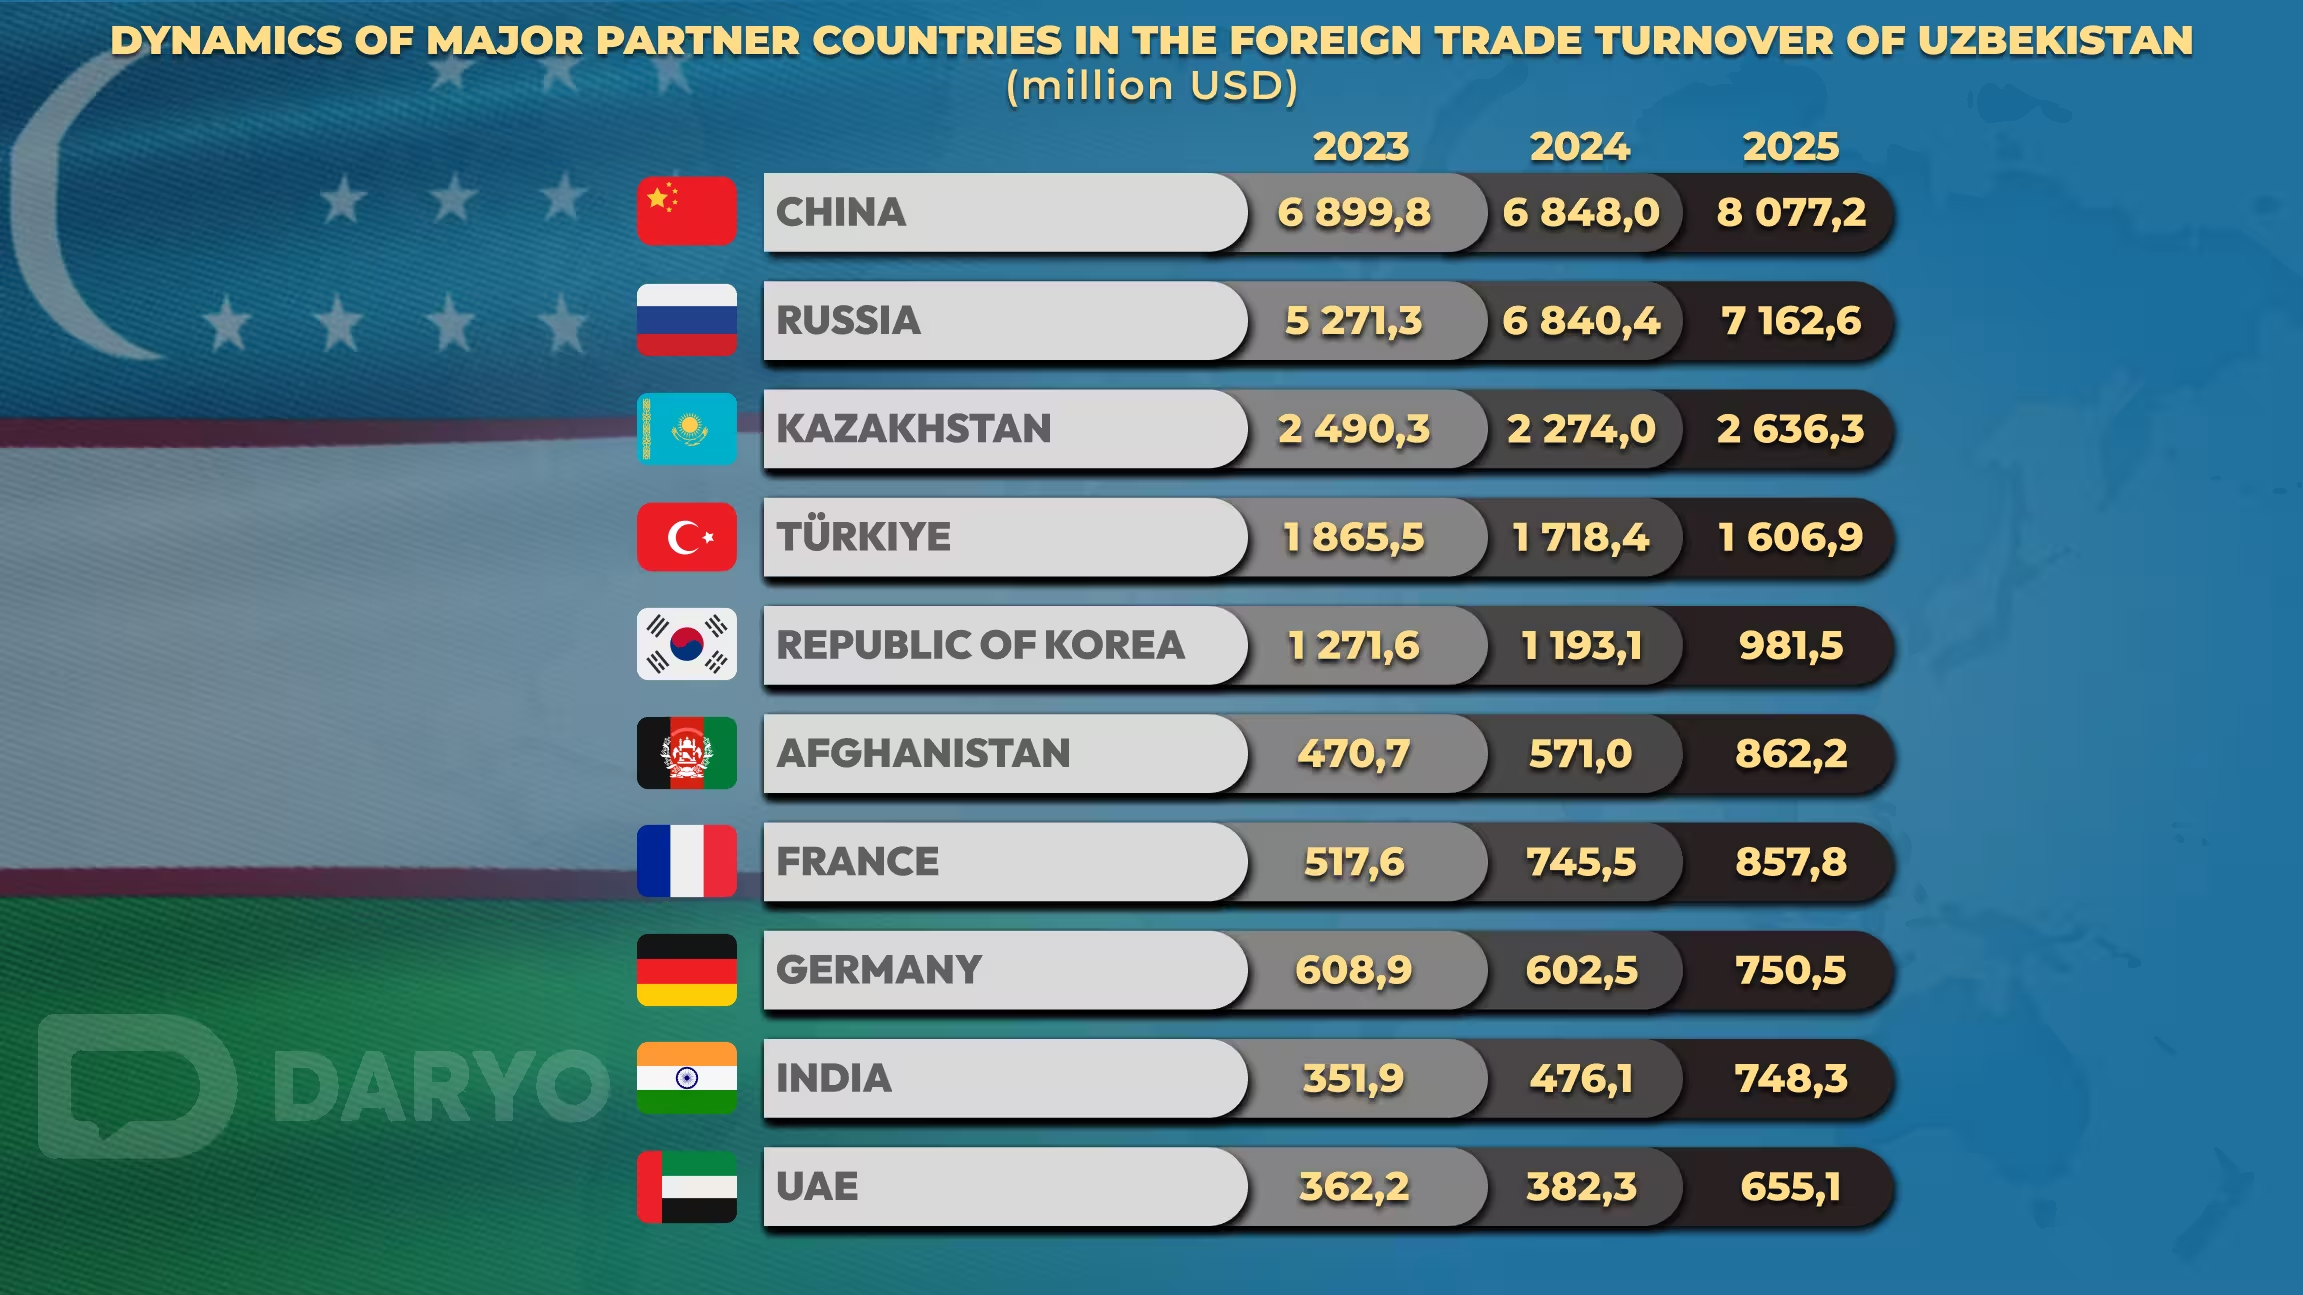
Uzbekistan maintained trade relations with 197 countries during the first seven months of 2025. China, Russia, and Kazakhstan continued to dominate its foreign trade structure.
Trade turnover with China reached $8.01bn, up from $6.85bn in 2024 and $6.90bn in 2023, accounting for 18.2% of total FTT. Russia followed with $7.16bn, compared to $6.84bn last year and $5.27bn in 2023, making up 16.1% of trade.
Trade with Kazakhstan stood at $2.64bn, compared to $2.27bn in 2024 and $2.49bn in 2023, representing 5.9%of the total. Other notable partners included Türkiye (3.6%) and South Korea (2.2%).
On the export side, Russia remained the largest destination with 12.3% of total exports, followed by China (5.5%), Kazakhstan (4.0%), Afghanistan (3.7%), Türkiye (3.0%), France (2.6%), the UAE (1.8%), Kyrgyzstan (1.6%), Tajikistan (1.4%), and Pakistan (1.2%). Combined, these ten countries accounted for 37.0% of total exports, underlining the regional concentration of Uzbekistan’s trade flows.
Sectoral Insights
Sectoral data highlights agriculture and services as key contributors to overall trade growth, while textiles saw a downturn.
Exports of fruit and vegetable products reached 1.28mn tons, an increase of 5.2% compared to the same period last year. In value terms, these exports totaled $1.07bn, up 35.2%, and accounted for 5.3% of total exports.
Service exports also recorded significant growth, rising 30.2% y/y to $4.85bn, or 24.1% of total exports. The bulk came from travel (52.5%) and transport services (32.8%), followed by telecommunications and IT (8.5%) and business services (2.9%).
By contrast, textile exports declined by 17.1% y/y to $1.47bn, representing 7.3% of total exports. Finished textiles made up 49% of the sector’s exports, while yarn accounted for 31%.
Imports totaled $24.29bn in January–July 2025, with goods making up $21.78bn and services $2.51bn. Machinery and transport equipment remained the largest import category at 33.3%, followed by industrial goods (16.0%) and chemicals (12.8%).
Imports were concentrated among a few major partners, with China supplying 28.7% of total imports, followed by Russia (19.3%), Kazakhstan (7.6%), Türkiye (4.1%), South Korea (3.9%), Germany (2.8%), and India (2.6%). Together, these seven countries accounted for more than two-thirds of Uzbekistan’s imports.
Service imports rose sharply, increasing 32.1% y/y to $2.51bn, or 10.3% of total imports. Travel services (55.9%) and transport (18.5%) dominated, followed by telecommunications and IT (10.2%) and business services (5.3%).
Follow Daryo's official Instagram and Twitter pages to keep current on world news.
Comments (0)