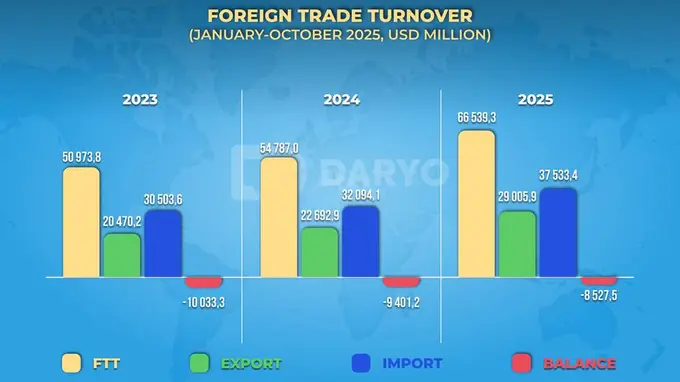
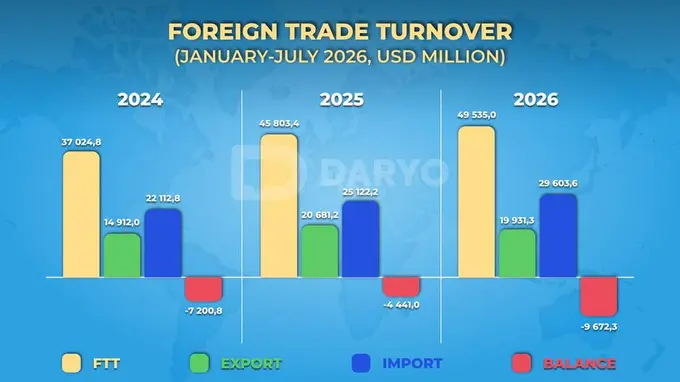
Uzbekistan’s foreign trade turnover (FTT) totaled $5.8bn in January 2026, increasing by $1.32bn, or 29.2%, year-on-year compared to the same period in 2025.
Exports reached $1.69bn, up 26.7% y/y, supported by growth in industrial goods, food products, textile shipments, and services. Imports rose 30.3% y/y to $4.14bn. As a result, the trade balance remained in deficit at –$2.44bn.
Key trade partners
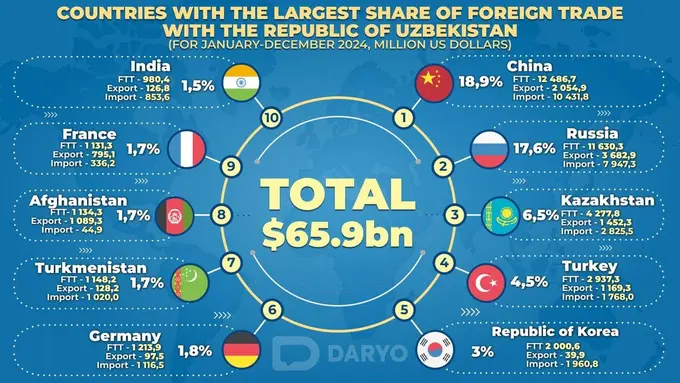
Uzbekistan maintained trade relations with 145 countries during January 2026. China, Russia, and Kazakhstan remained the country’s leading trading partners.
Trade turnover with China reached $1.62bn, up from $993.4mn in 2025 and $1.13bn in 2024, accounting for 27.9% of total FTT. Russia followed with $1.09bn, compared to $797.8mn last year and $766.2mn in 2024, representing 18.7% of total turnover. Trade with Kazakhstan amounted to $414.1mn, up from $314.1mn in 2025 and $270.9mn in 2024, making up 7.1% of total FTT. Other major partners included Turkiye (3.6%) and Afghanistan (2.4%).
On the export side, Russia remained Uzbekistan’s largest destination, accounting for 19.2% of total exports, followed by China (10.5%), Afghanistan (8.1%), France (6.1%), Turkiye (5.0%), Kazakhstan (4.8%), Kyrgyz Republic (2.7%), Tajikistan (2.7%), and UAE (2.4%). Together, these nine countries accounted for 60.0% of total exports.

Sectoral insights
Sectoral data pointed to strong performance in industrial goods, agriculture, textiles, and services.
Exports of fruit and vegetable products reached 106,800 tons, up 13.6% y/y. In value terms, shipments totaled $99.4mn, a 21.6% increase compared to the same period in 2025, accounting for 5.9% of total exports.
Textile exports amounted to $216.5 mn, accounting for 12.8% of total exports, up 9.0% y/y. Finished textiles made up 51.4% of textile exports, while yarn accounted for 31.3%.
Service exports increased 44.1% y/y to $742.1mn, representing 43.8% of total exports. Travel services dominated with 47.9%, followed by transport services (35.9%), telecommunications and IT services (10.9%), and other business services (1.9%).
In the overall export structure, goods accounted for 56.2% of total exports, including industrial goods (18.1%), food products and live animals (10.0%), chemical products (10.0%), and various finished goods (7.1%).
Import structure
Imports totaled $4.14bn in January 2026. Goods imports increased by $869.4mn y/y to $3.69bn, while service imports rose 26.3% y/y to $443.0mn.
Machinery and transport equipment dominated the import structure with a 35.9% share, followed by industrial goods (13.9%) and chemical products (11.8%).
Uzbekistan imported goods and services from over 125 countries during the period. The main suppliers were China (35.0%), Russia (18.5%), Kazakhstan (8.0%), South Korea (3.0%), Turkiye (3.0%), Germany (2.3%), and Turkmenistan (2.0%). These countries accounted for more than 70% of total imports.
Service imports represented 10.7% of total imports. Travel services accounted for 56.2%, followed by transport services (18.7%), telecommunications, computer and information services (10.2%), and other business services (8.7%).