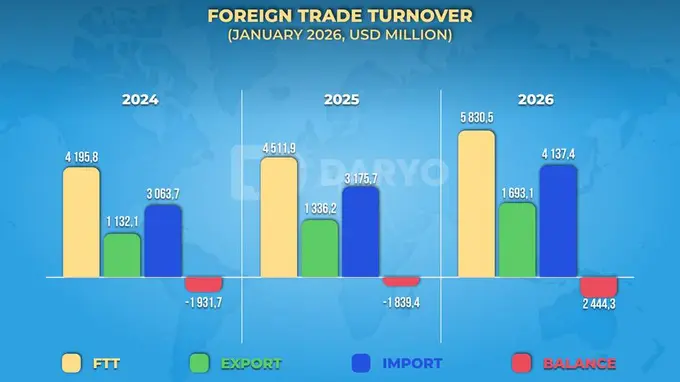
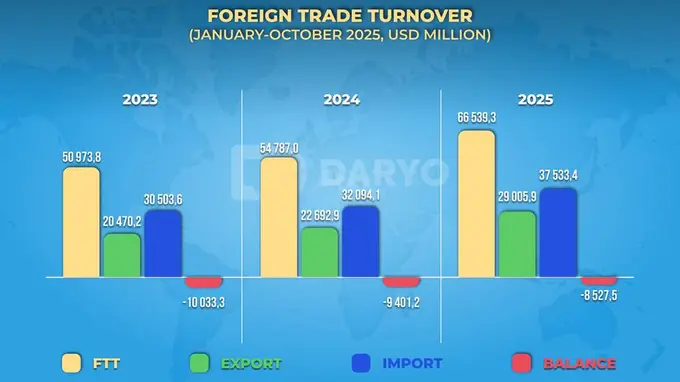
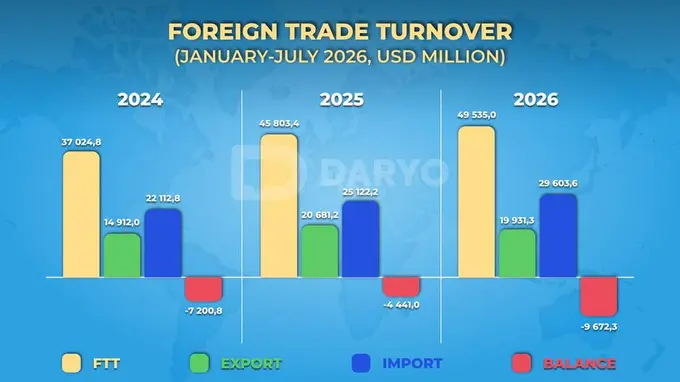
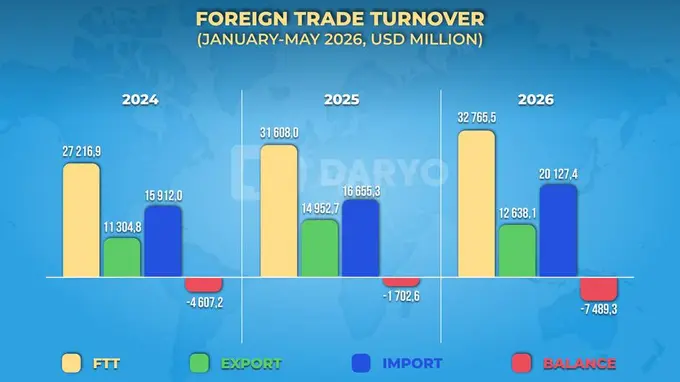
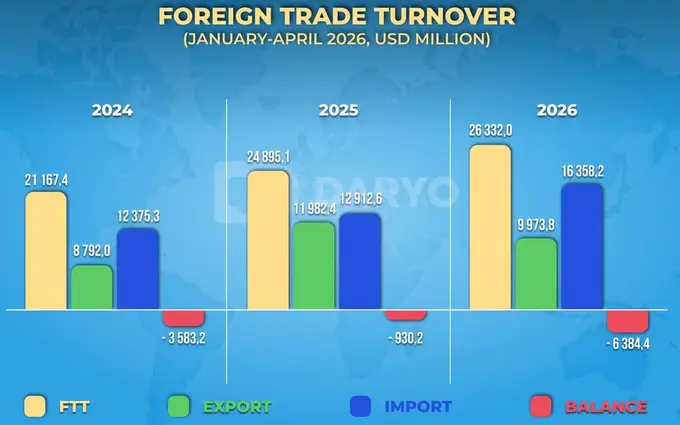
Uzbekistan’s foreign trade turnover (FTT) totaled $59.8bn in January–September 2025, marking a year-on-year increase of $11.14bn, or 22.9%, compared to the same period in 2024. The growth was driven by a strong rise in exports, while imports recorded more moderate gains.
Exports reached $26.68bn, up 33.3% y/y, supported by higher agricultural shipments, industrial goods, and service exports. Imports stood at $33.11bn, an increase of 15.6% y/y. As a result, the trade balance remained in deficit at –$6.43bn.
Key Trade Partners
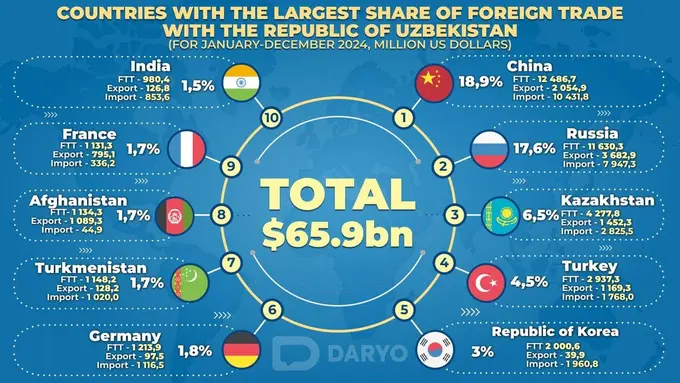
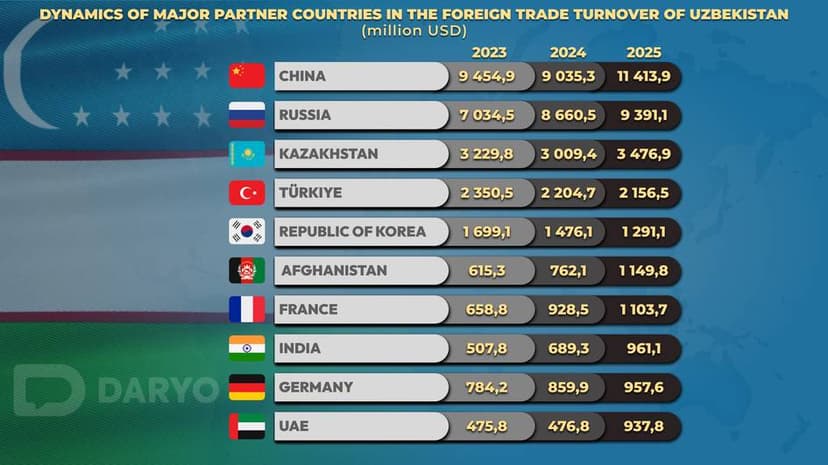
Uzbekistan maintained trade relations with 206 countries during the first nine months of 2025. China, Russia, and Kazakhstan continued to lead as the country’s main trading partners.
Trade turnover with China reached $11.41bn, up from $9.04bn in 2024 and $9.45bn in 2023, accounting for 19.1% of total FTT. Russia followed with $9.39bn, compared to $8.66bn last year and $7.03bn in 2023, representing 15.7% of total turnover. Trade with Kazakhstan totaled $3.48bn, compared to $3.01bn in 2024 and $3.23bn in 2023, making up 5.8% of total FTT. Other notable partners included Turkiye (3.6%) and South Korea (2.2%).
On the export side, Russia remained Uzbekistan’s largest destination, accounting for 12.2% of total exports, followed by China (5.2%), Kazakhstan (4.0%), Afghanistan (3.8%), Turkiye (3.1%), France (2.6%), UAE (2.1%), Kyrgyzstan (1.6%), Tajikistan (1.5%), and Pakistan (1.1%). Combined, these ten countries represented 37.3% of total exports.
Sectoral Insights
Sectoral data highlighted strong performance in agriculture and services, while textiles posted a decline.
Exports of fruit and vegetable products reached 1.61mn tons, a 7.5% increase compared to the same period in 2024. In value terms, these exports totaled $1.45bn, up 39.3% y/y, and accounted for 5.5% of total exports.
Service exports rose 31.6% y/y to $6.76bn, representing 25.3% of total exports. The majority came from travel (52.9%) and transport (31.7%), followed by telecommunications and IT (7.3%) and business services (3.2%).
By contrast, textile exports fell 16.6% y/y to $1.85bn, accounting for 6.9% of total exports. Finished textile products made up 50.8% of the total, while yarn represented 29%.
In the overall export structure, goods accounted for 74.7%, including industrial goods (10.7%), food and live animals (7.7%), chemicals and similar products (5.7%), and various finished goods (4.7%).
Import Structure
Imports reached $33.11bn in January–September 2025, driven primarily by the inflow of machinery and transport equipment. Goods imports amounted to $29.47bn, up $3.53bn from the same period in 2024, while service imports totaled $3.65bn.
The largest share of imports was made up of machinery and transport equipment (33.9%), followed by industrial goods (15.9%) and chemicals (12.3%).
Uzbekistan imported goods and services from 175 countries, with the main suppliers being China (30.3%), Russia (18.6%), Kazakhstan (7.3%), Turkiye (4.0%), South Korea (3.8%), Germany (2.6%), and India (2.5%). These seven countries accounted for more than two-thirds of total imports.
Service imports increased 34.9% y/y to $3.65bn, making up 11.0% of total imports. The largest components were travel (51.1%), transport (20.3%), telecommunications and IT (10.6%), and business services (6.6%).