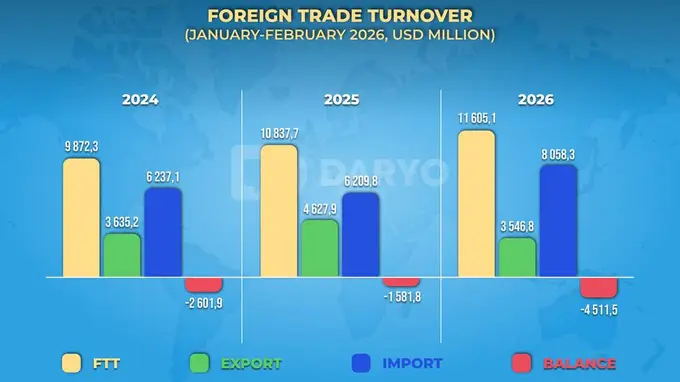
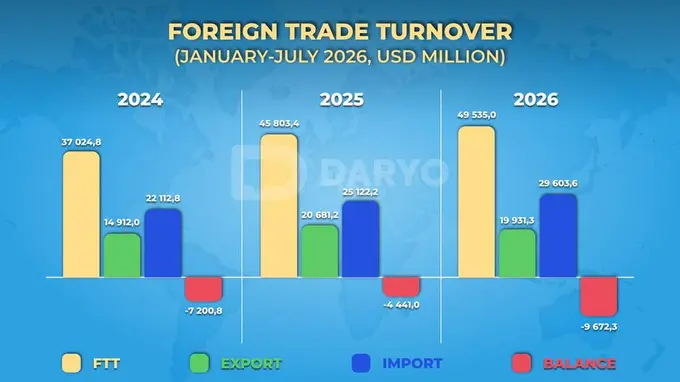
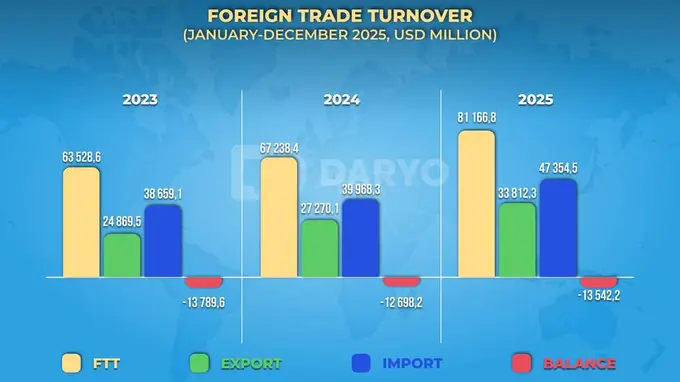
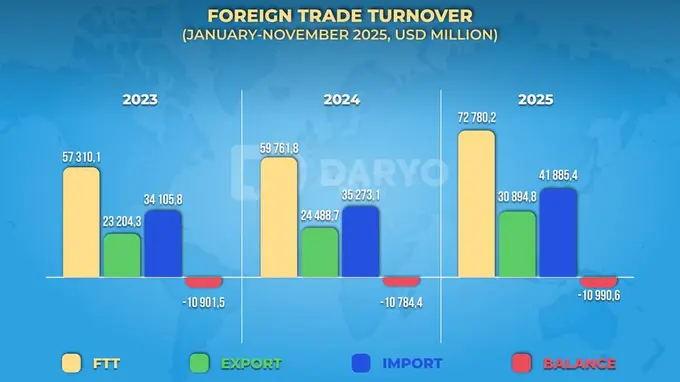
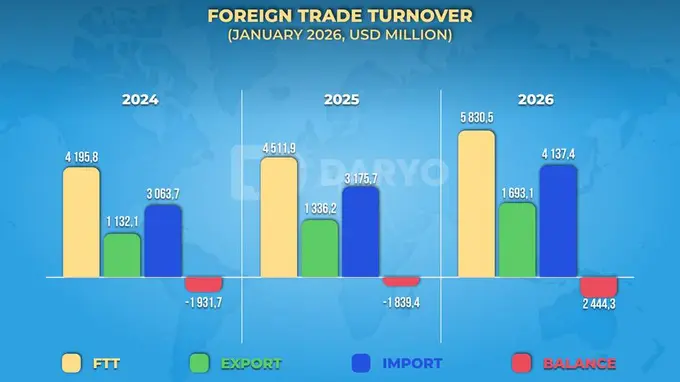
Uzbekistan’s foreign trade turnover (FTT) reached $32.77bn in January–May 2026, increasing by $1.16bn, or 3.7%, year-on-year compared to the same period in 2025.
Exports declined to $12.64bn, down 15.5% y/y, while imports increased 20.8% y/y to $20.13bn. As a result, the trade balance remained in deficit at –$7.49bn. Excluding gold, goods exports demonstrated steady growth, rising 29.4% y/y to $6.5bn.
Key trade partners
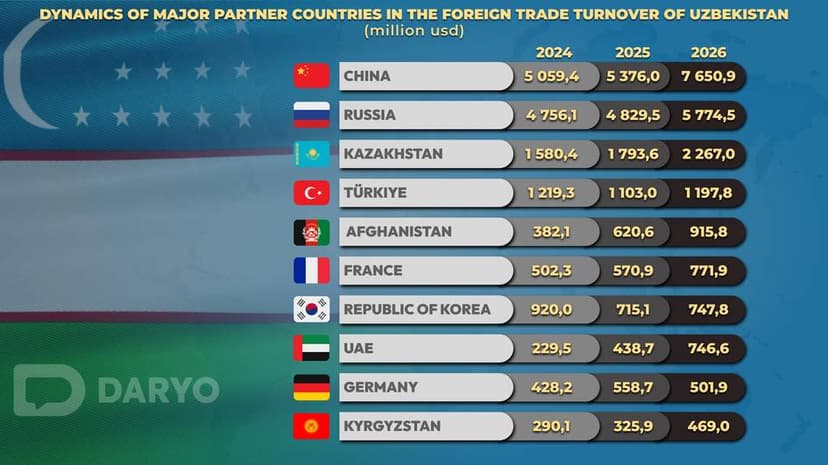
Uzbekistan maintained trade relations with more than 185 countries during January–May 2026. China, Russia and Kazakhstan remained the country's leading trading partners.
Trade turnover with China reached $7.65bn, up from $5.38bn in 2025 and $5.06bn in 2024, accounting for 23.4% of total FTT. Russia followed with $5.77bn, compared to $4.83bn last year and $4.76bn in 2024, representing 17.6% of total turnover. Trade with Kazakhstan amounted to $2.27bn, up from $1.79bn in 2025 and $1.58bn in 2024, making up 6.9% of total FTT. Other major partners included Turkiye (3.7%) and Afghanistan (2.8%).
On the export side, Russia remained Uzbekistan's largest destination, accounting for 14.9% of total exports, followed by China (9.2%), Afghanistan (6.5%), France (5.0%), Kazakhstan (4.5%), Turkiye (4.0%), Hong Kong (3.0%), the UAE (2.7%) and the Kyrgyz Republic (2.7%). Collectively, these markets represented over 50% of total exports.
Sectoral insights
Sectoral data indicated continued growth in agriculture, textiles and services despite the overall decline in exports.
Exports of fruit and vegetable products stood at 736,000 tons, down 0.8% y/y. In value terms, shipments totaled $635.8mn, up 2.7% from the same period in 2025 and accounting for 5.0% of total exports.
Textile exports amounted to $1.3bn, accounting for 10.0% of total exports, up 20.1% y/y. More than half of textile exports consisted of finished products (50.8%), while yarn contributed 32.3%.
Service exports increased 34.9% y/y to $4.59bn, representing 36.3% of total exports. Travel services represented the largest share at 48.9%, ahead of transport services (36.2%), telecommunications, computer and information services (9.6%), and other business services (2.0%).
Uzbekistan exported $1.50bn worth of non-monetary gold during the reporting period, compared with $6.49bn in January–May 2025.
In the overall export structure, goods accounted for 63.7% of total exports, including industrial goods (15.1%), various manufactured goods (8.4%), chemical products (8.3%), and food and live animals (8.0%).
Trade in mineral fuels continued to grow. Exports of fuel and energy products increased 10.1% y/y to $660.7mn, while imports rose 31.7% to $1.86bn.
Import structure
Imports totaled $20.13bn in January–May 2026. Goods imports increased by approximately $3.2bn y/y to $18.07bn, while service imports rose 14.7% y/y to $2.05bn.
Machinery and transport equipment dominated the import structure with a 33.1% share, followed by industrial goods (15.3%) and chemical products (12.3%).
Uzbekistan imported goods and services from more than 155 countries during the period. The main suppliers were China (32.3%), Russia (19.3%), Kazakhstan (8.4%), the Republic of Korea (3.6%), Turkiye (3.4%), Germany (2.2%), and India (2.1%). Together, these countries accounted for more than 70% of total imports.
Service imports represented 10.2% of total imports. Travel services accounted for 44.8%, followed by transport services (23.9%), telecommunications, computer and information services (10.9%), and other business services (10.2%).